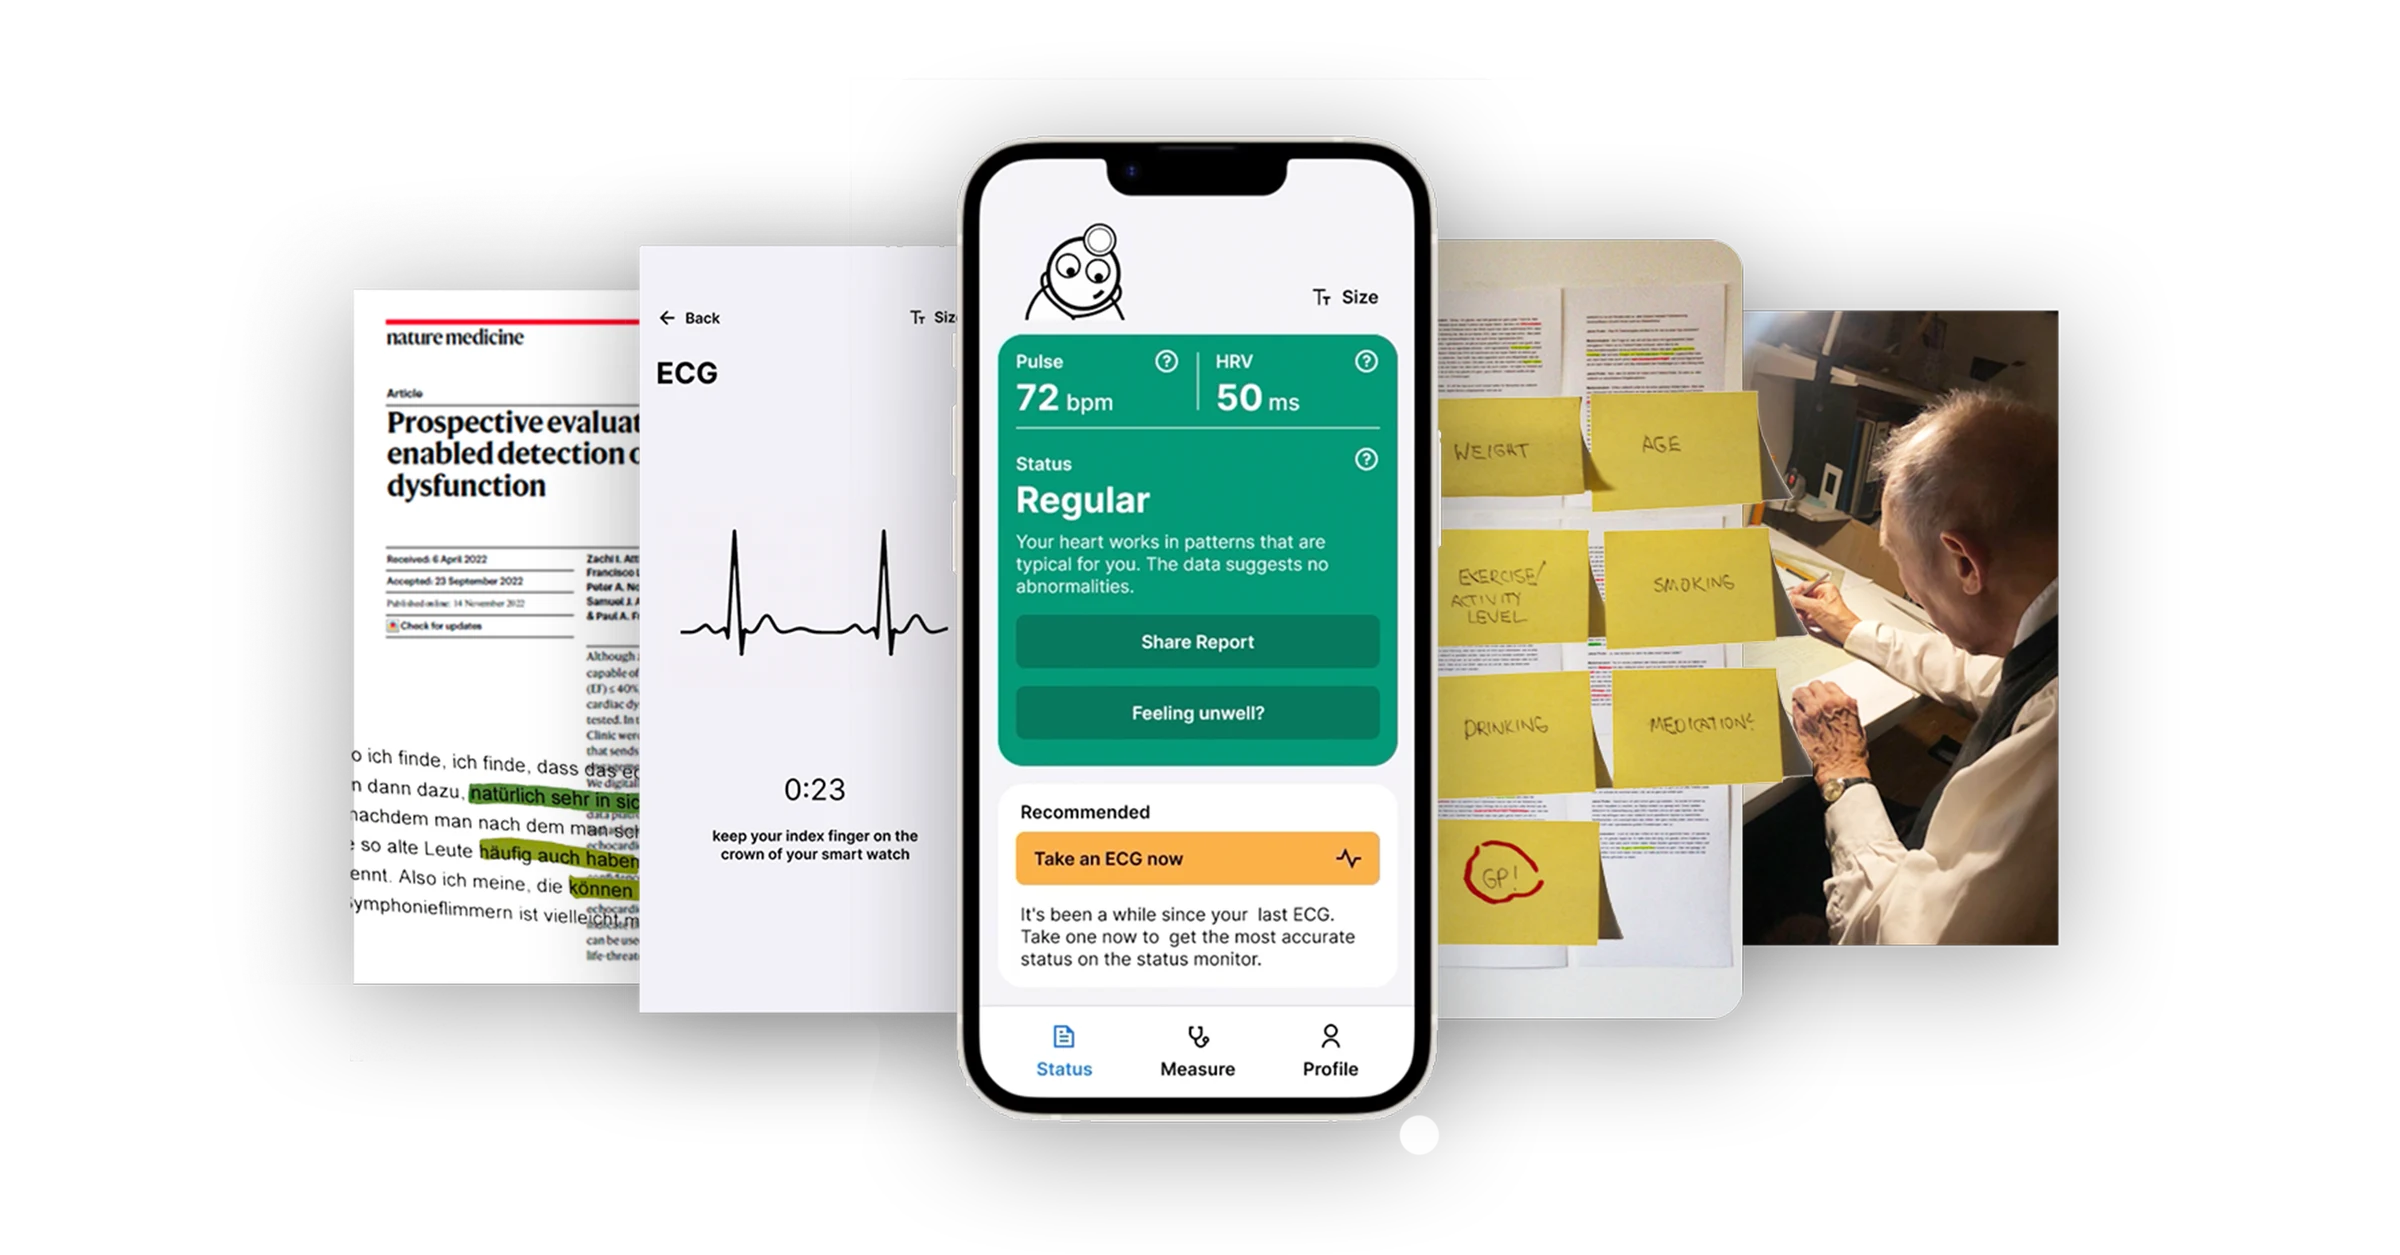
CardioGuard
Designing with empathy - research with seniors informed accessible heart health application
Details

Brief
"Design a UI for a specific health issue. Pay special attention to accessibility"
From this relatively broad task my masters course mate Manfredi and I narrowed our aim down to a health app aiding early detection of heart failure through AI analysis of smart watch measurements, which include heart rate, ECG and nightly respatory rate.
We wanted to make this app accessible specifically for elderly users. We envisioned that doctors too would be able to sign up and access patient data directly, but decided to concentrate on the patient-facing side of the app for the two-week project.
Research

Research
Talking to an Expert
I begun research with a semi-structured interview with a German friend and medical student specialising in early detection of cardiovascular disease in his PhD thesis. I got an overview from him about what patient data and symptoms he would like to know about and whether there were any pain points for doctors or patients in the diagnostic progress.
Scientific Literature
Research in the current scientific literature confirmed our concept in showing that AI is becoming very good at making accurate inferences about heart performance from ECG readings alone when other methods of examination would have been necessary in the past.
We found that it would be better to keep detailed measurements “under the hood” and only show a general status, as a lay person is often not qualified to judge if abnormal values are just unique traits or pathologic irregularities.
Finally, we found that to keep engagement with the app as high as possible, simplification of complex data would be effective both for people high and low in health literacy.
Competitor Analysis
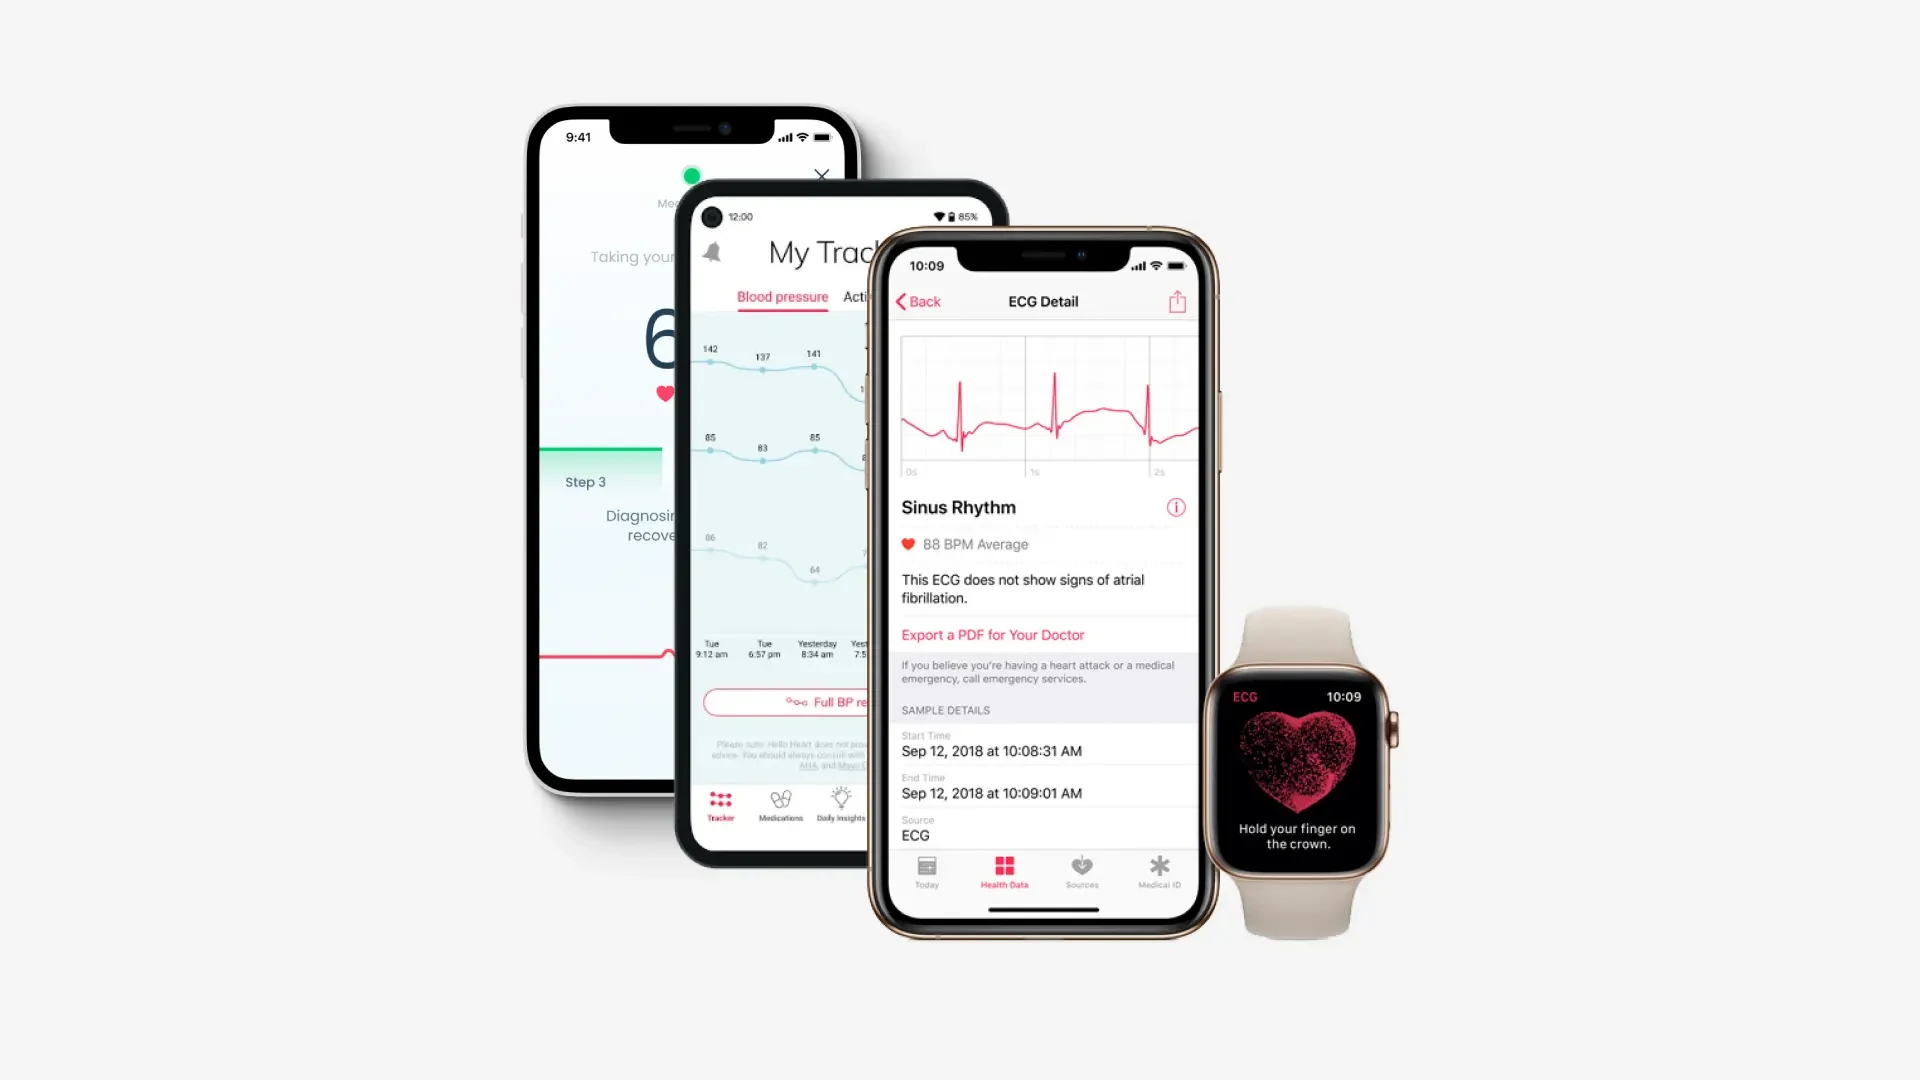
In a competitor analysis we focused primarily on design traits instead of business aspects or gaps in the market. Third party apps often did not seem very trustworthy both in the method of measurement as well as in presentation and design. Another issue we found with apps like Apple’s “Health” was that they showed too many values or included too many different health aspects so they lost transparency and clarity in UX. From all the different research we had one takeaway:
Health tracking and health-related content on the internet can be intimidating and overburdening. Ironically, stess and anxiety have adverse effects on cardiac health. Therefore the app should display only actionable information in a manor that is not anxiety-inducing where it doesn’t need to be.
Definition
Definition
Defining User Needs and App Goals
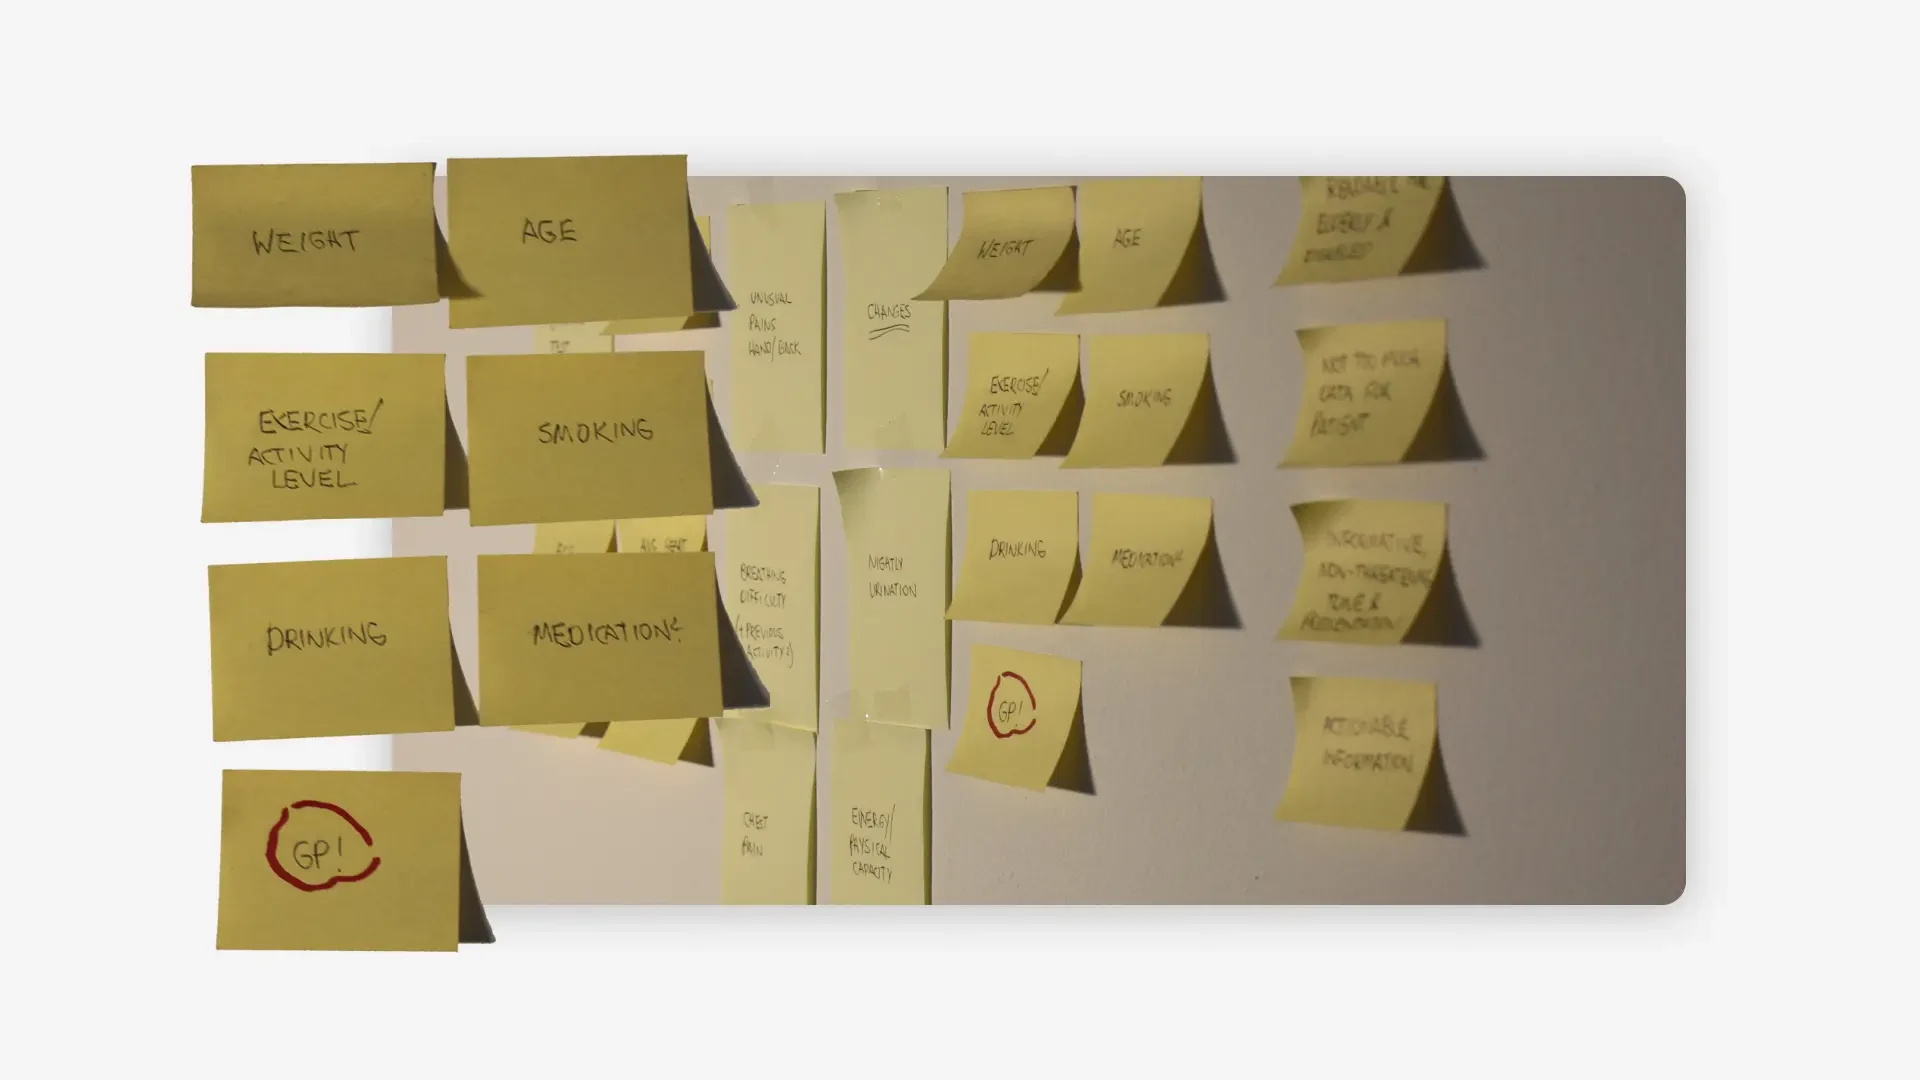
Structuring our research, we then organised data that could be measured, data we needed users to report, personal data needed on sign up and aspects of presentation in an affinity diagram. We concluded that our main focuses for the project were:
- Creating a human and personal touch
- Make it easy to understand and read
- Non-frightening presentation and no rushed diagnosis
- Reminding patients to keep information up to date
Accordingly, we created personas to further understand users needs and behaviours, such as:
Mary, 69 years old. Mary is a retired teacher who enjoys gardening and doing yoga. She is concerned about her heart health and wants to monitor her condition regularly, which is why her GP has recommended CardioGuard to her. She has some experience using smartphones but doesn't want to spend too much time figuring out how to use the app. Mary wants the app to be easy to use and understand, and wants to receive alerts if any issues are detected. She gets frustrated when technology is overly complicated or difficult to use.
Prototyping & Testing
Prototyping & Testing
Finding false design assumptions through testing with elderly users
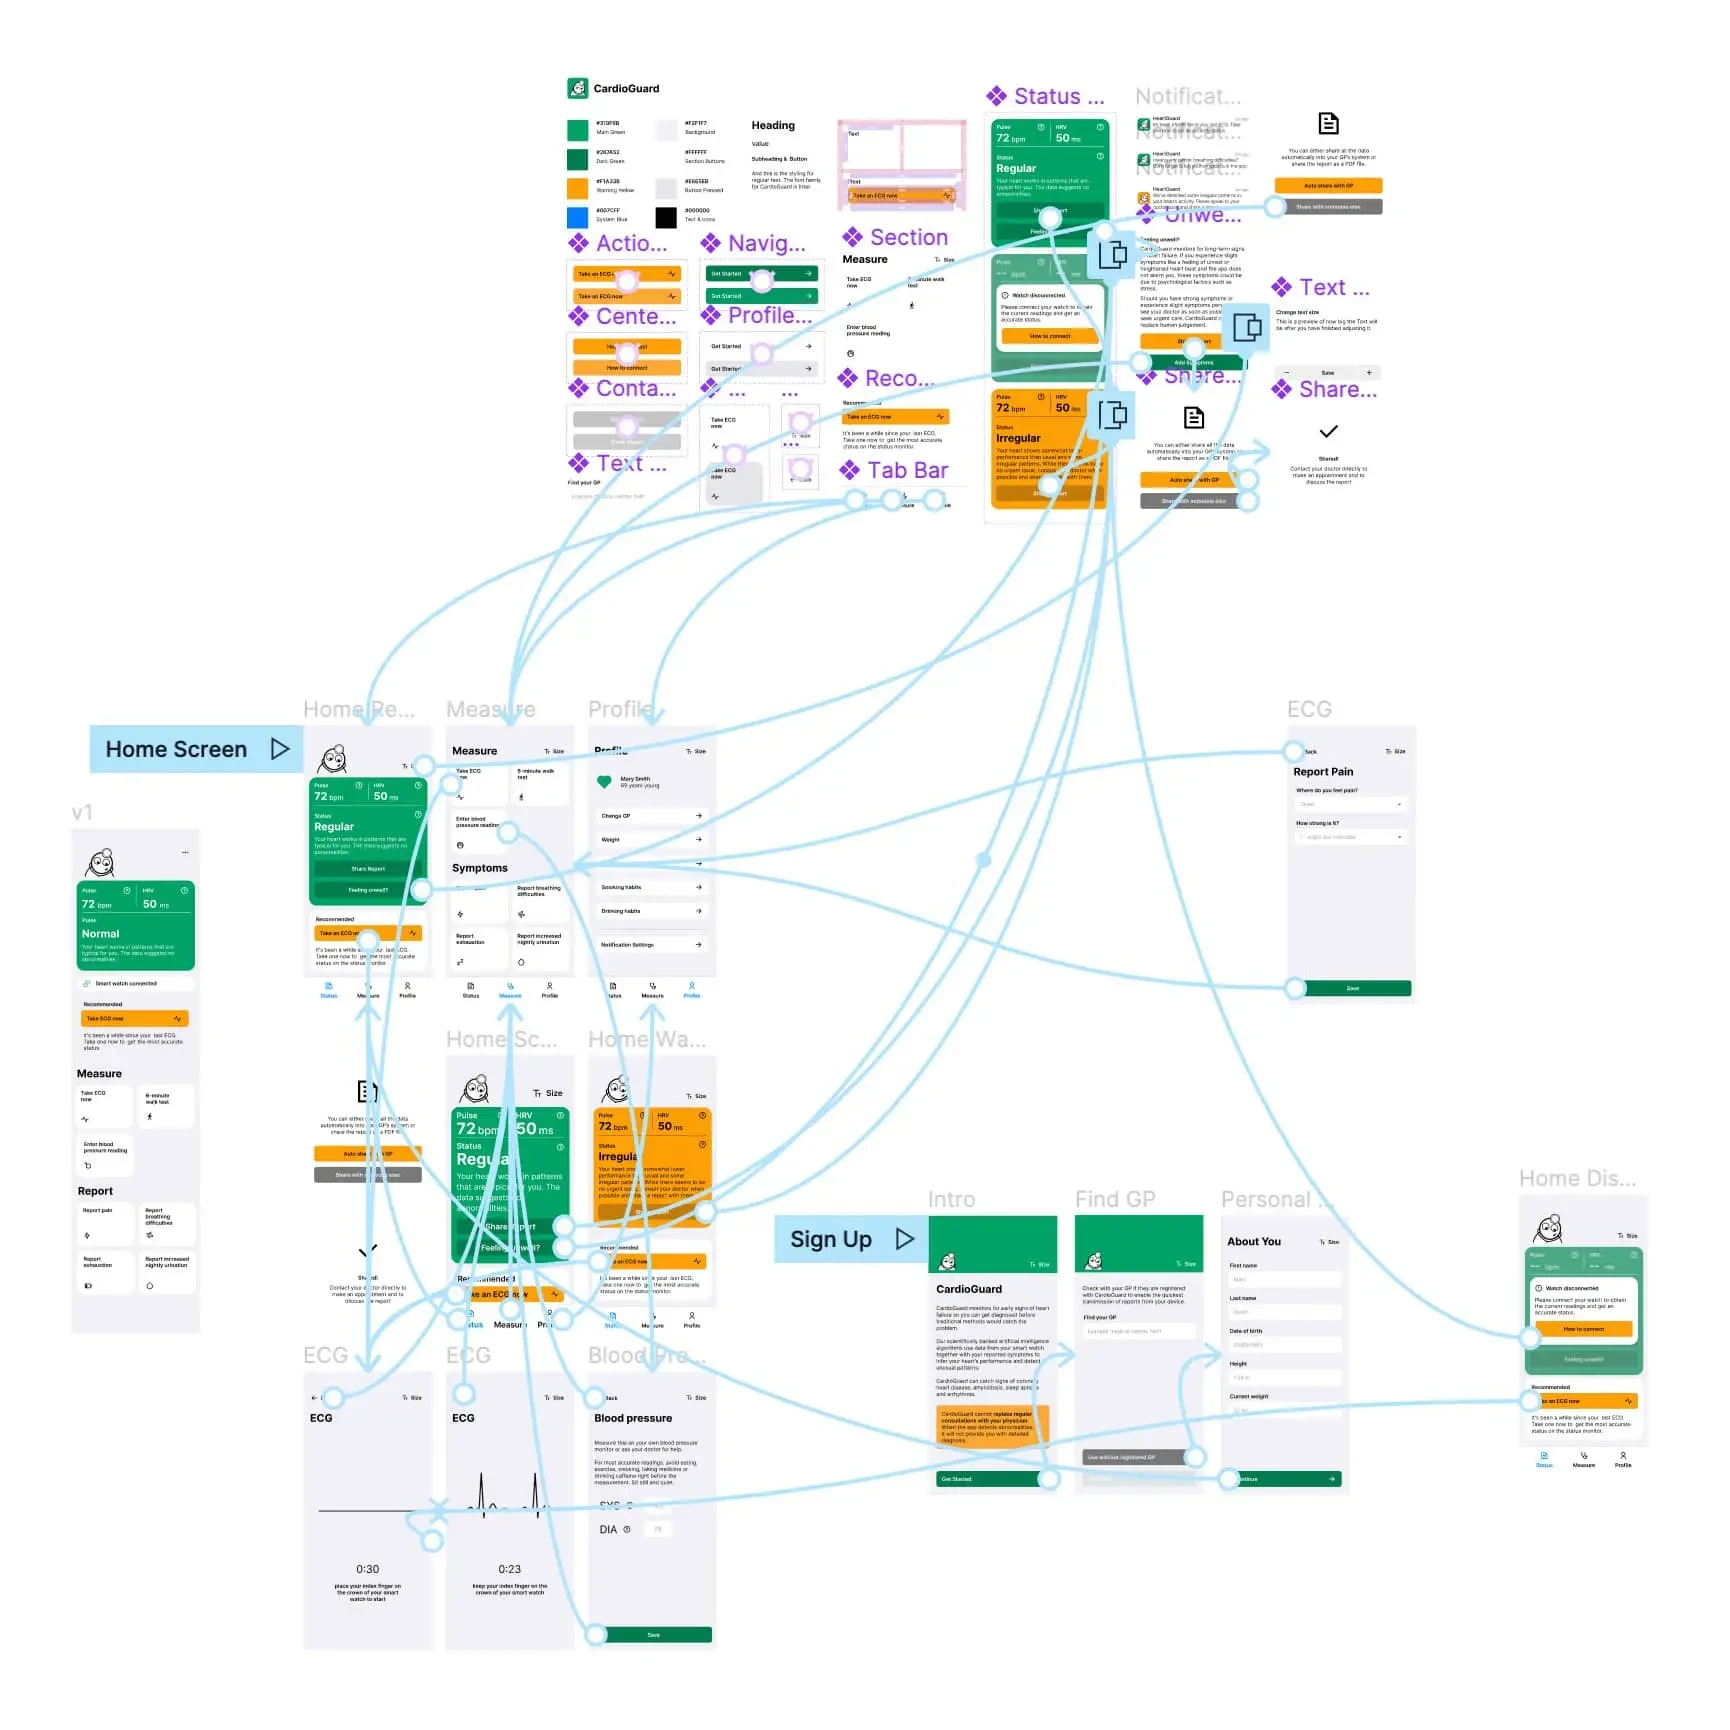
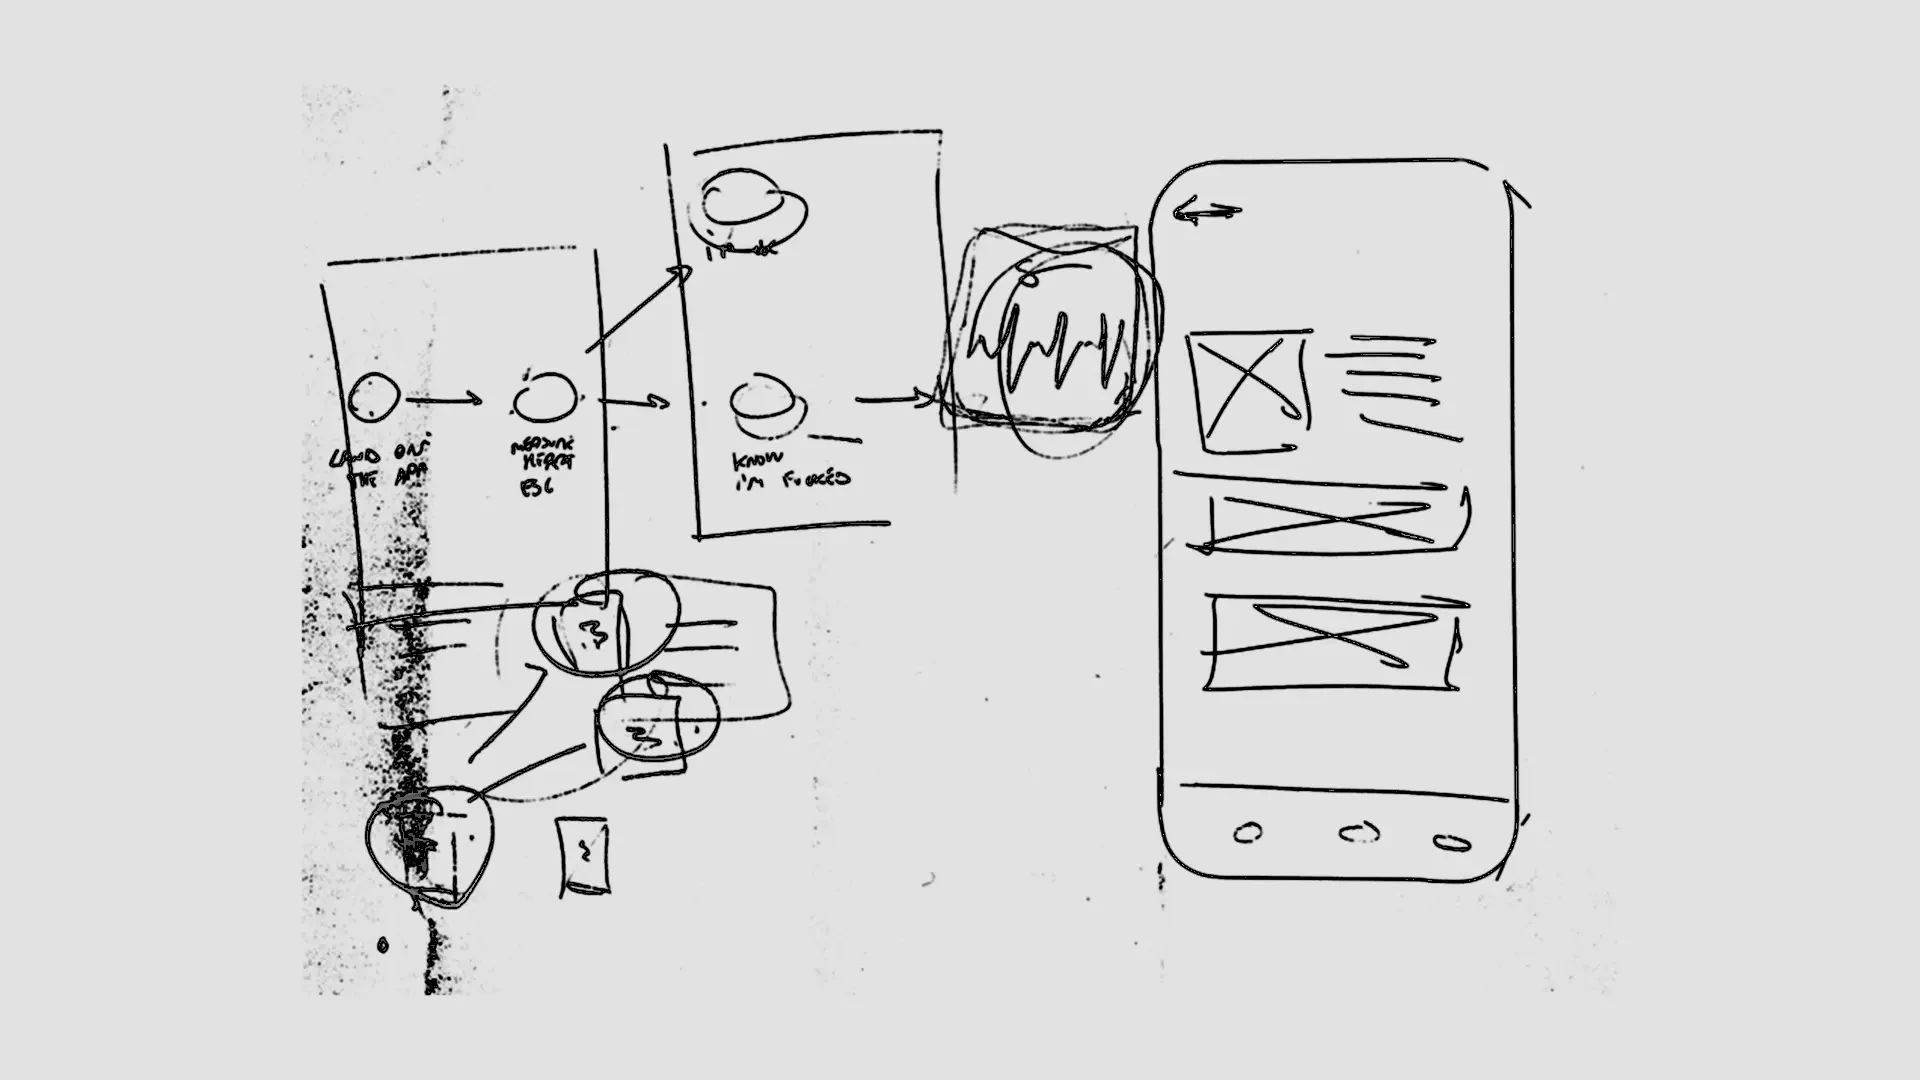
In the ideation stage, I was able to learn a lot from Manfredi who came into the project with a few years of professional design experience. Together we created flow charts to structure the applications functions and to lay out processes like the sign up. We started with hand sketches to get a feel for available space and basic placement, then went on to create digital wireframes.
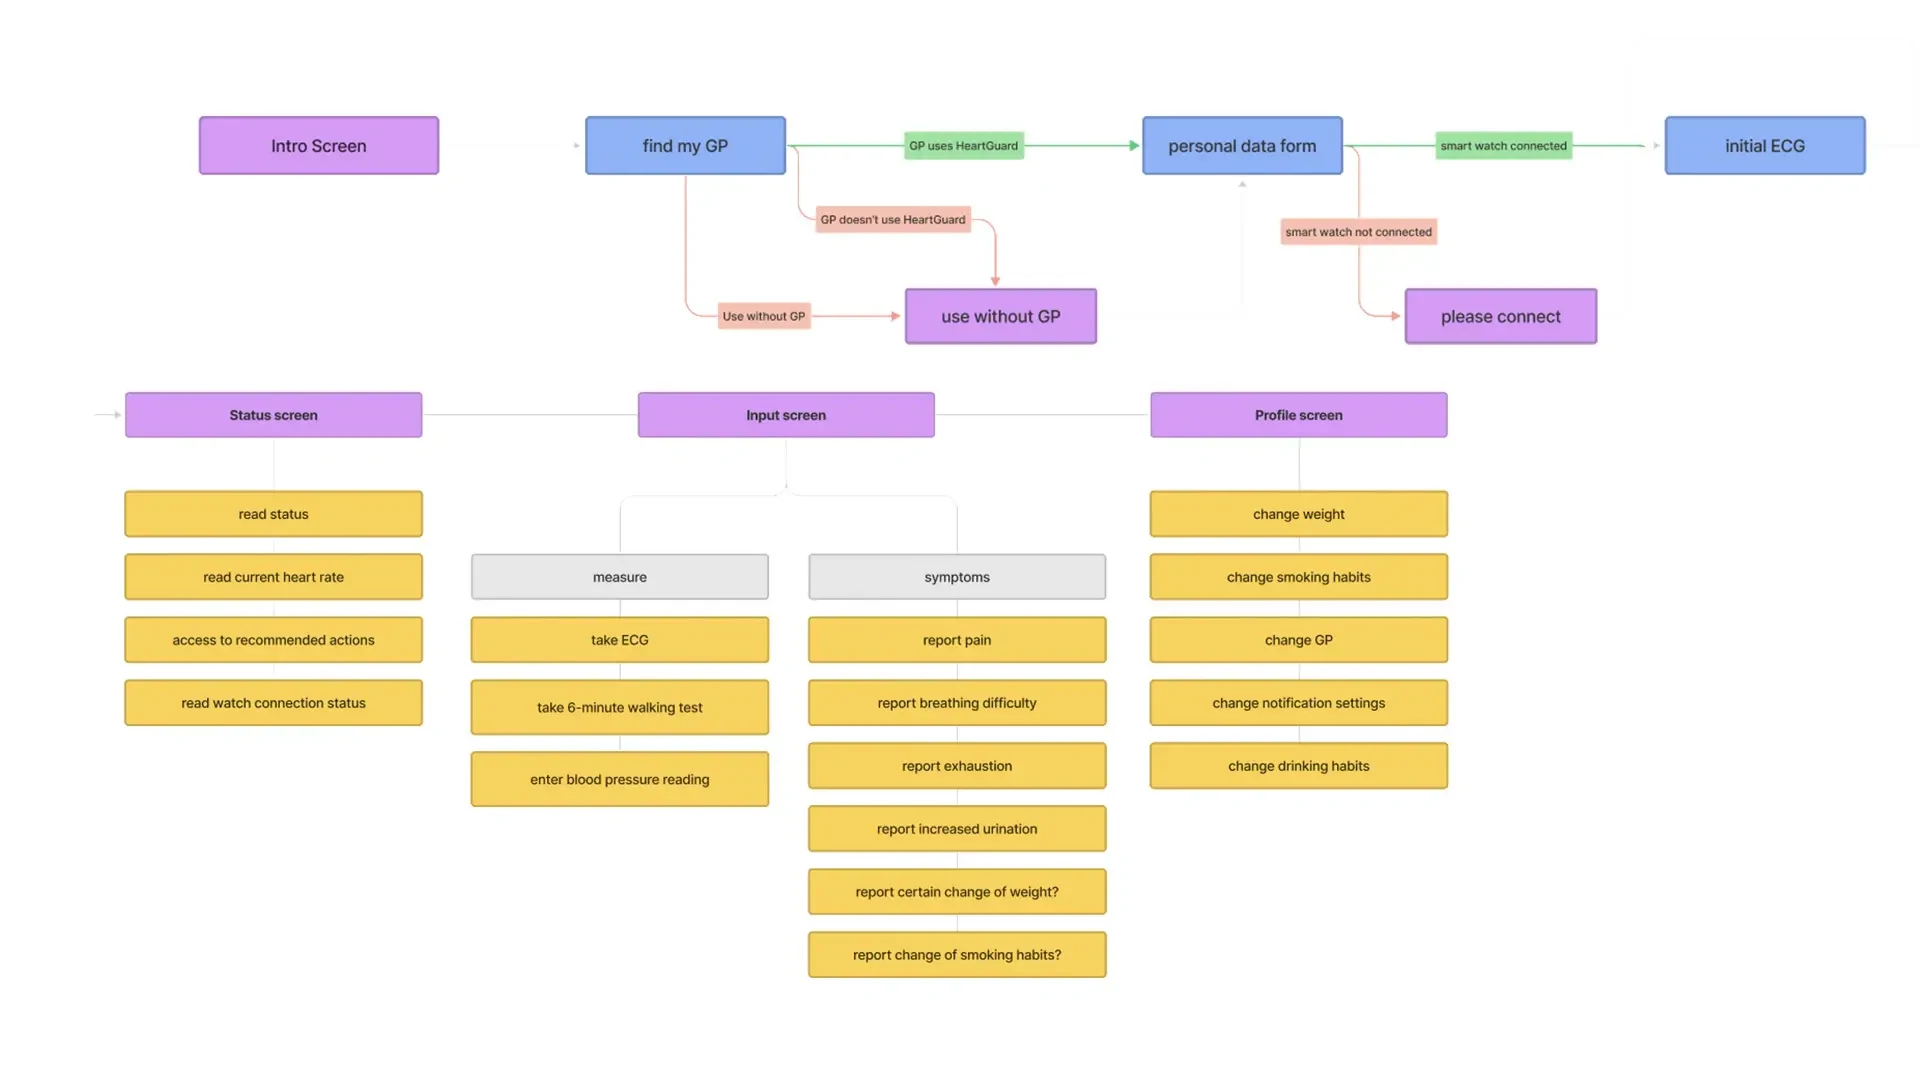
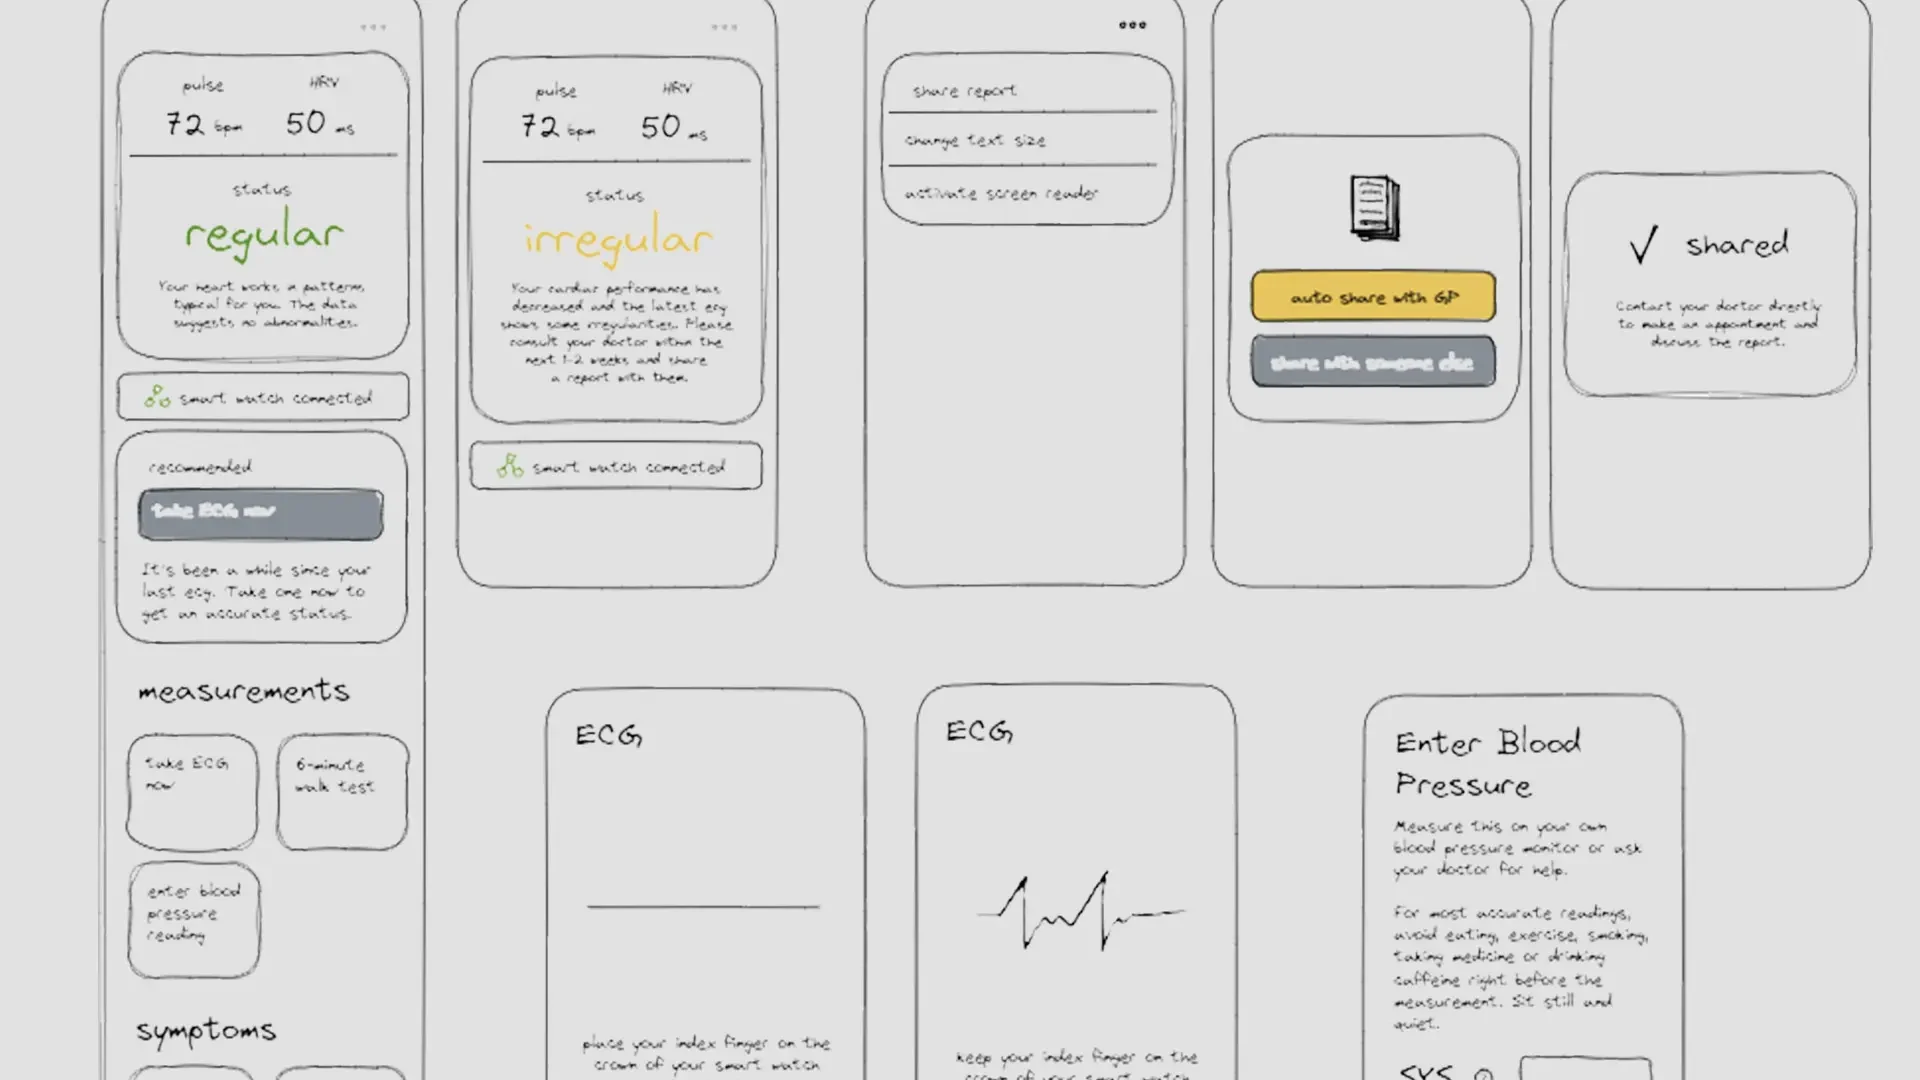
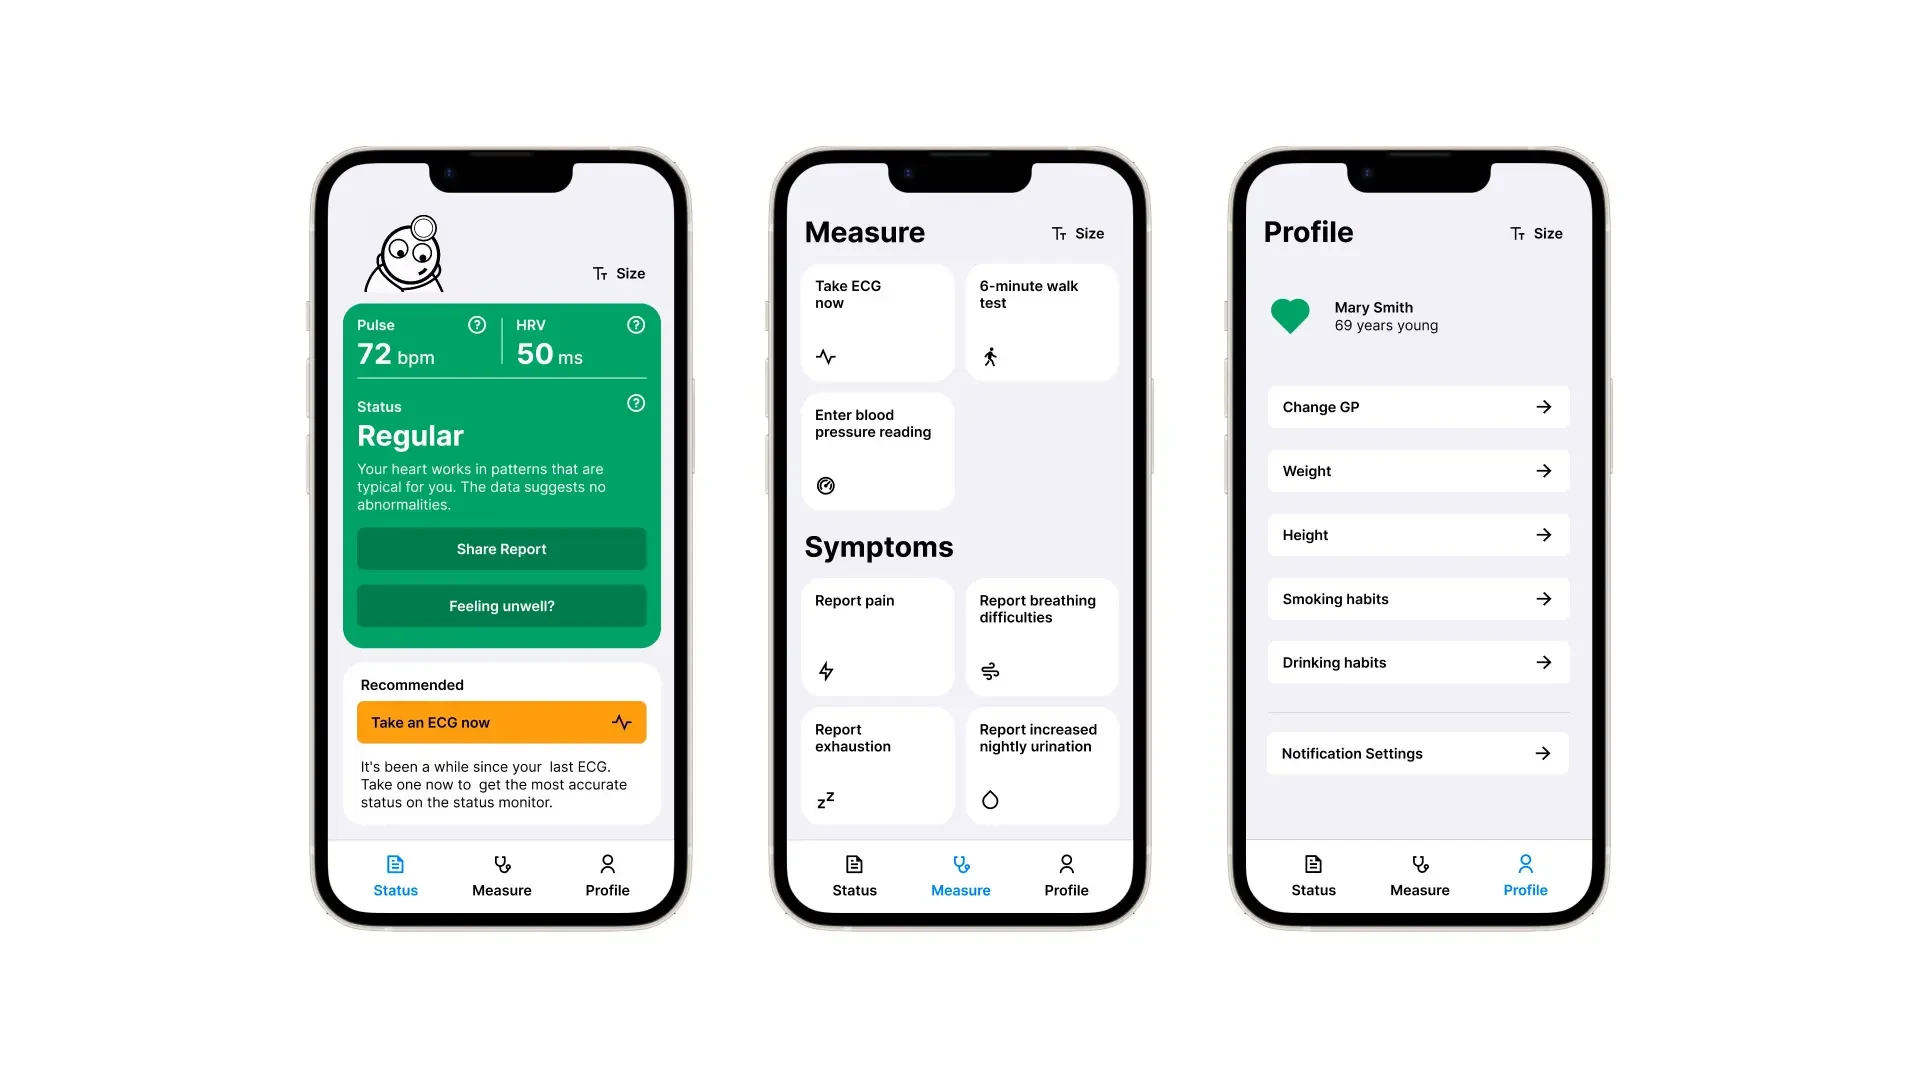
We decided we would not use the colour red or alarming language; the main status would only be regular or irregular. For a patient with known issues, the status would still remain regular as long as no changes in condition were detected. We also added an animated doctor mannequin to make the app friendly and provide a character to the name “CardioGuard”.
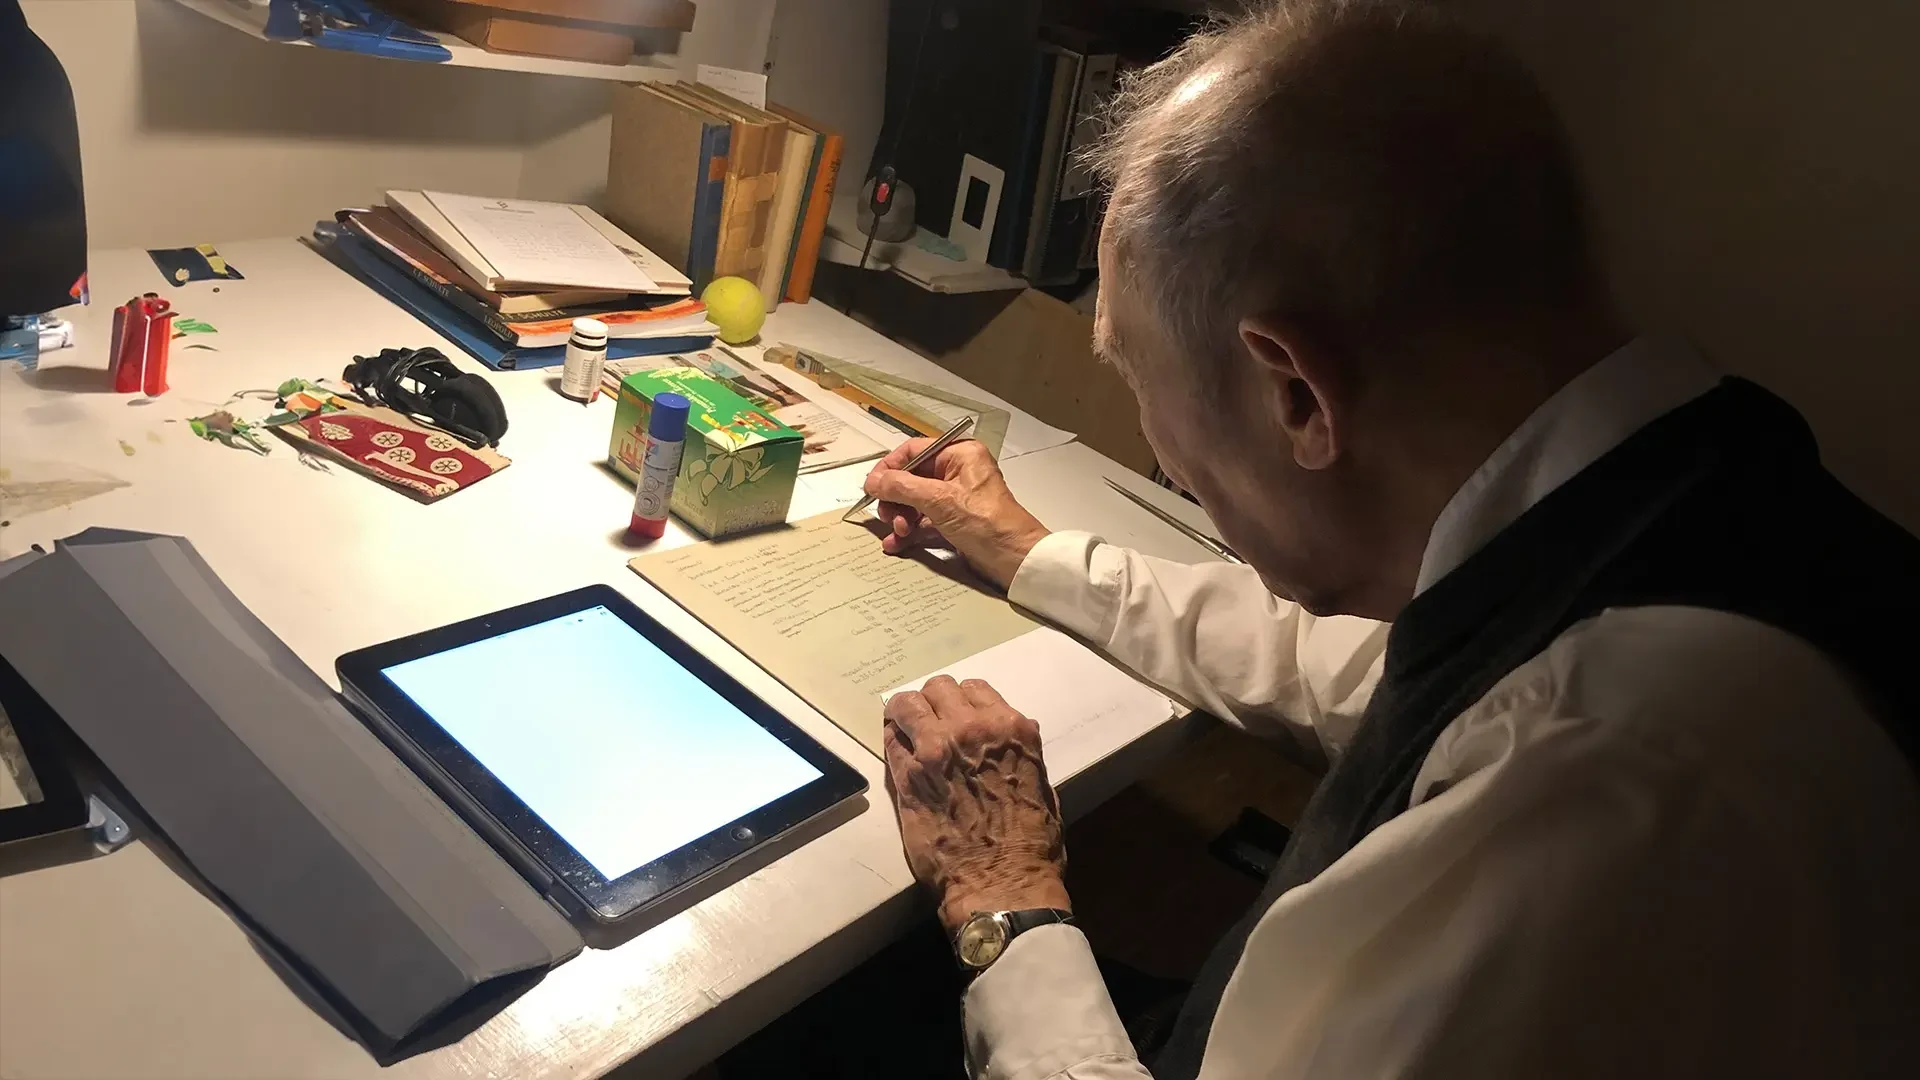
We tested our Figma prototype with eight users of ages between 54 and 86. This phase for me served as a reminder about how important it is to challenge own assumptions – what might be true and obvious for you might not be the case for every user.
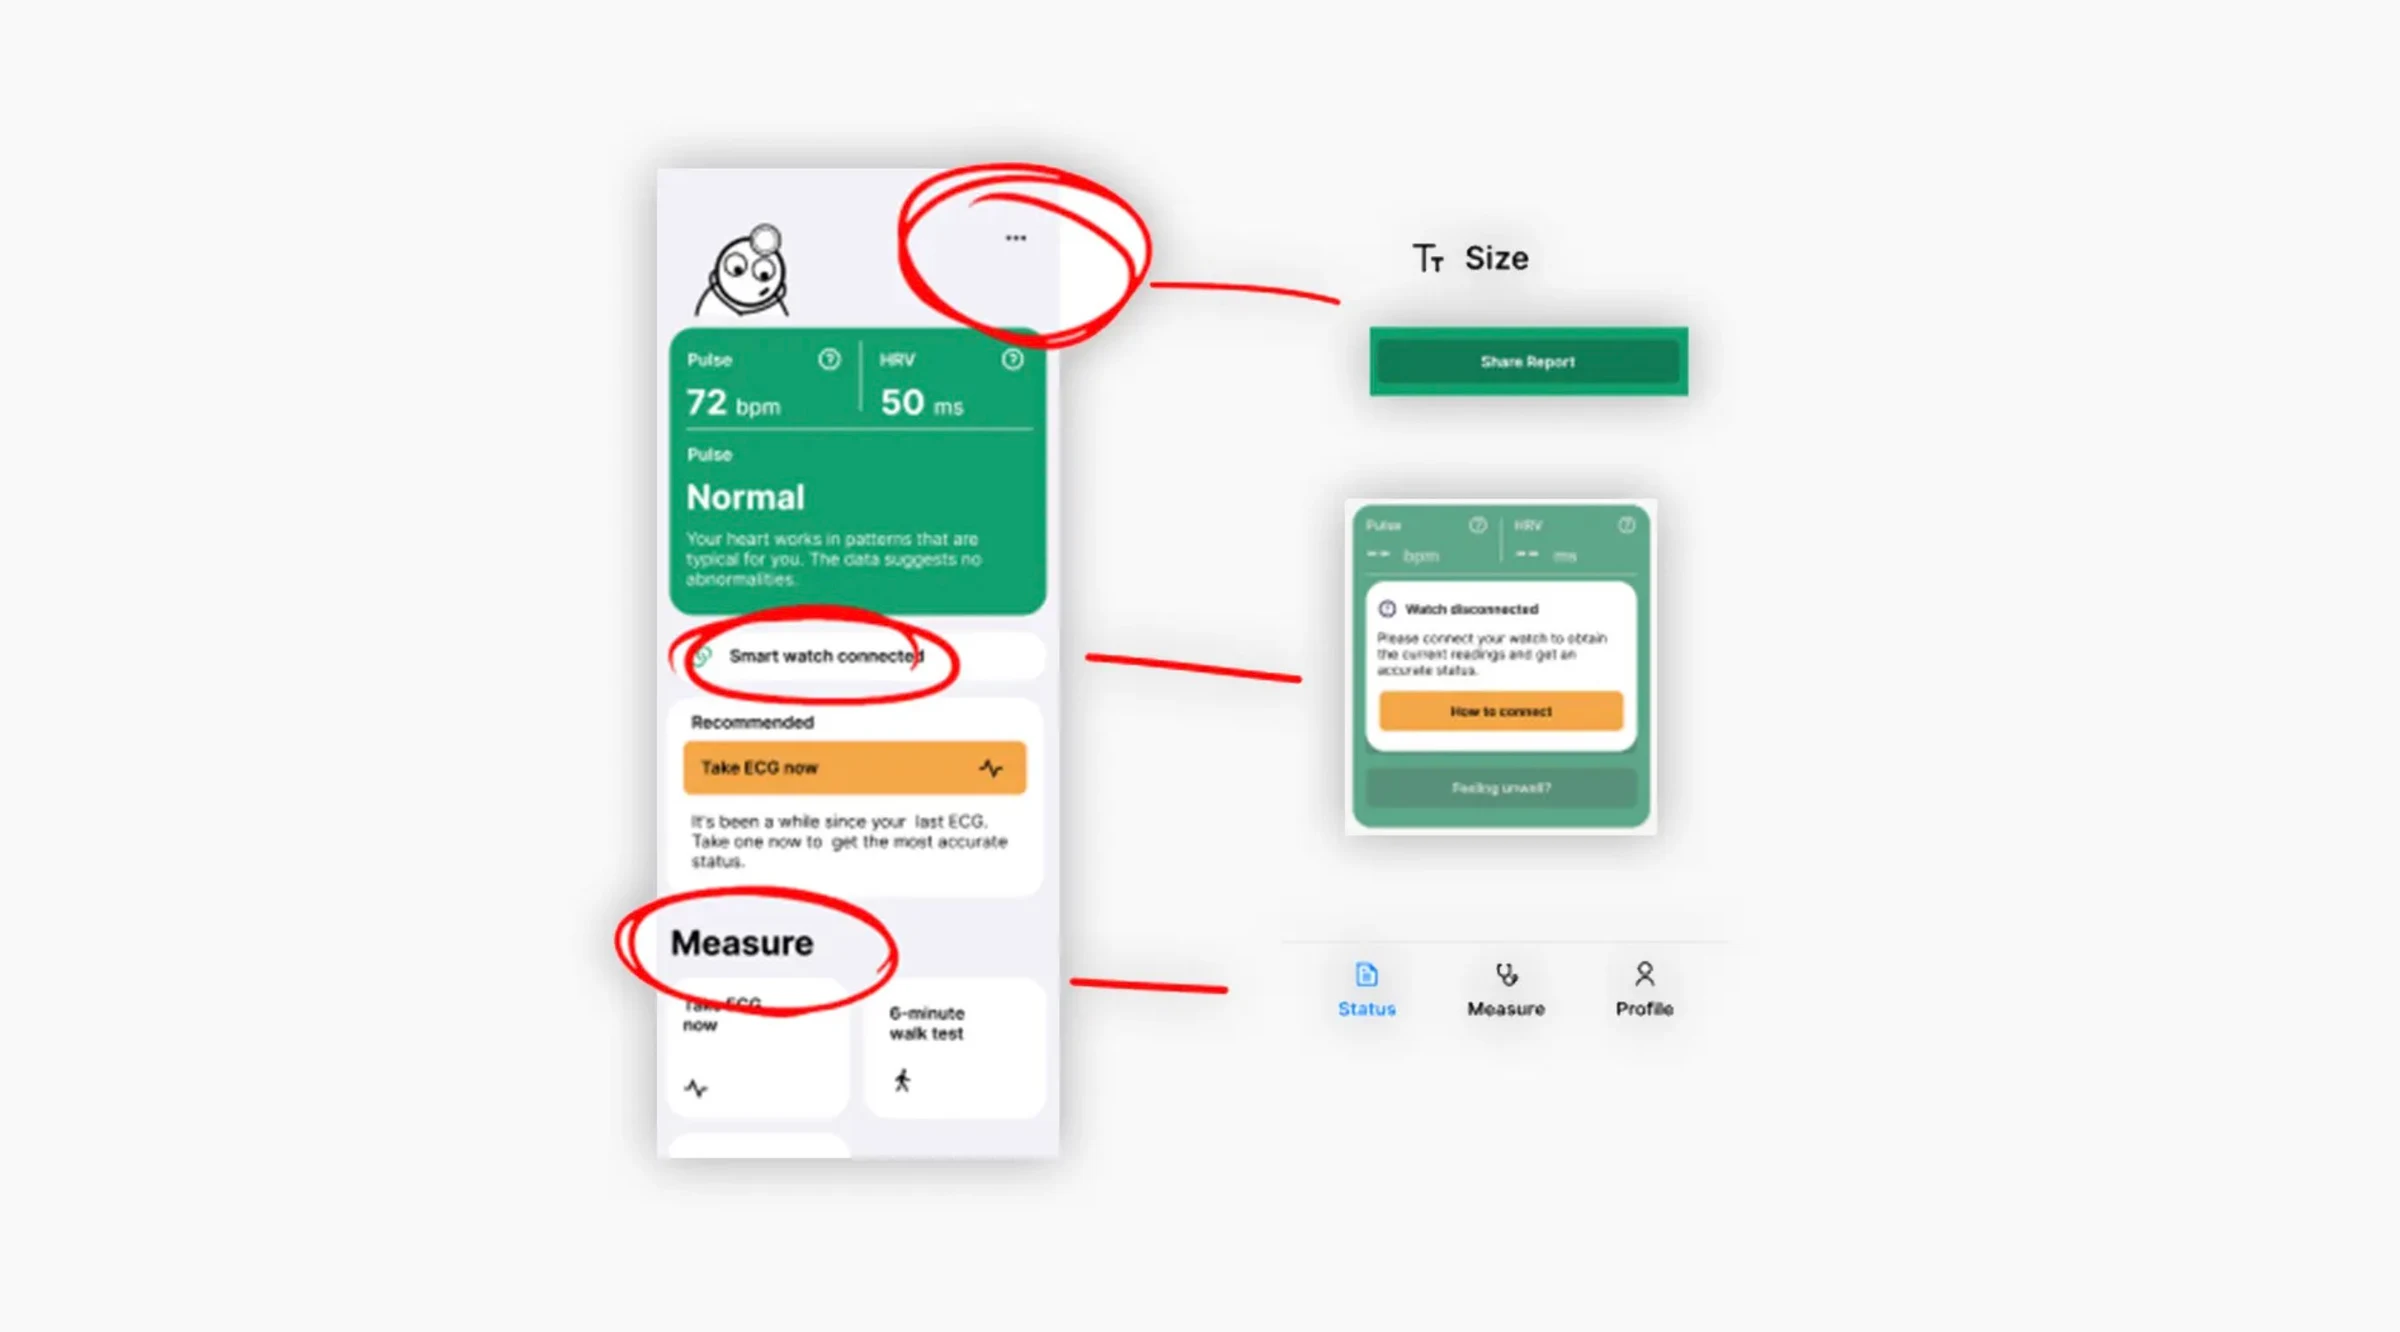
For instance, we had put the option to share a report in a three-dot sub menu. When asked to find the function, most of our test subjects did not understand what the three dots meant. Where for our generation it might have been clear that they indicated the presence of “more options”, for someone with lower digital literacy they remained obscure. We therefore decided to make all important functions immediately visible and label icons that might be unclear. We also re-introduced a bottom tab bar to make functions easier to find.
Delivery
Delivery
Final Prototype
After the two-week project we arrived at our current prototype. Here are some impressions including the Figma design system we created in the process.