Glace
Making investment impact palpable for Gen Z using augmented reality in arctic ice visualisation.
Details
Research
The Research
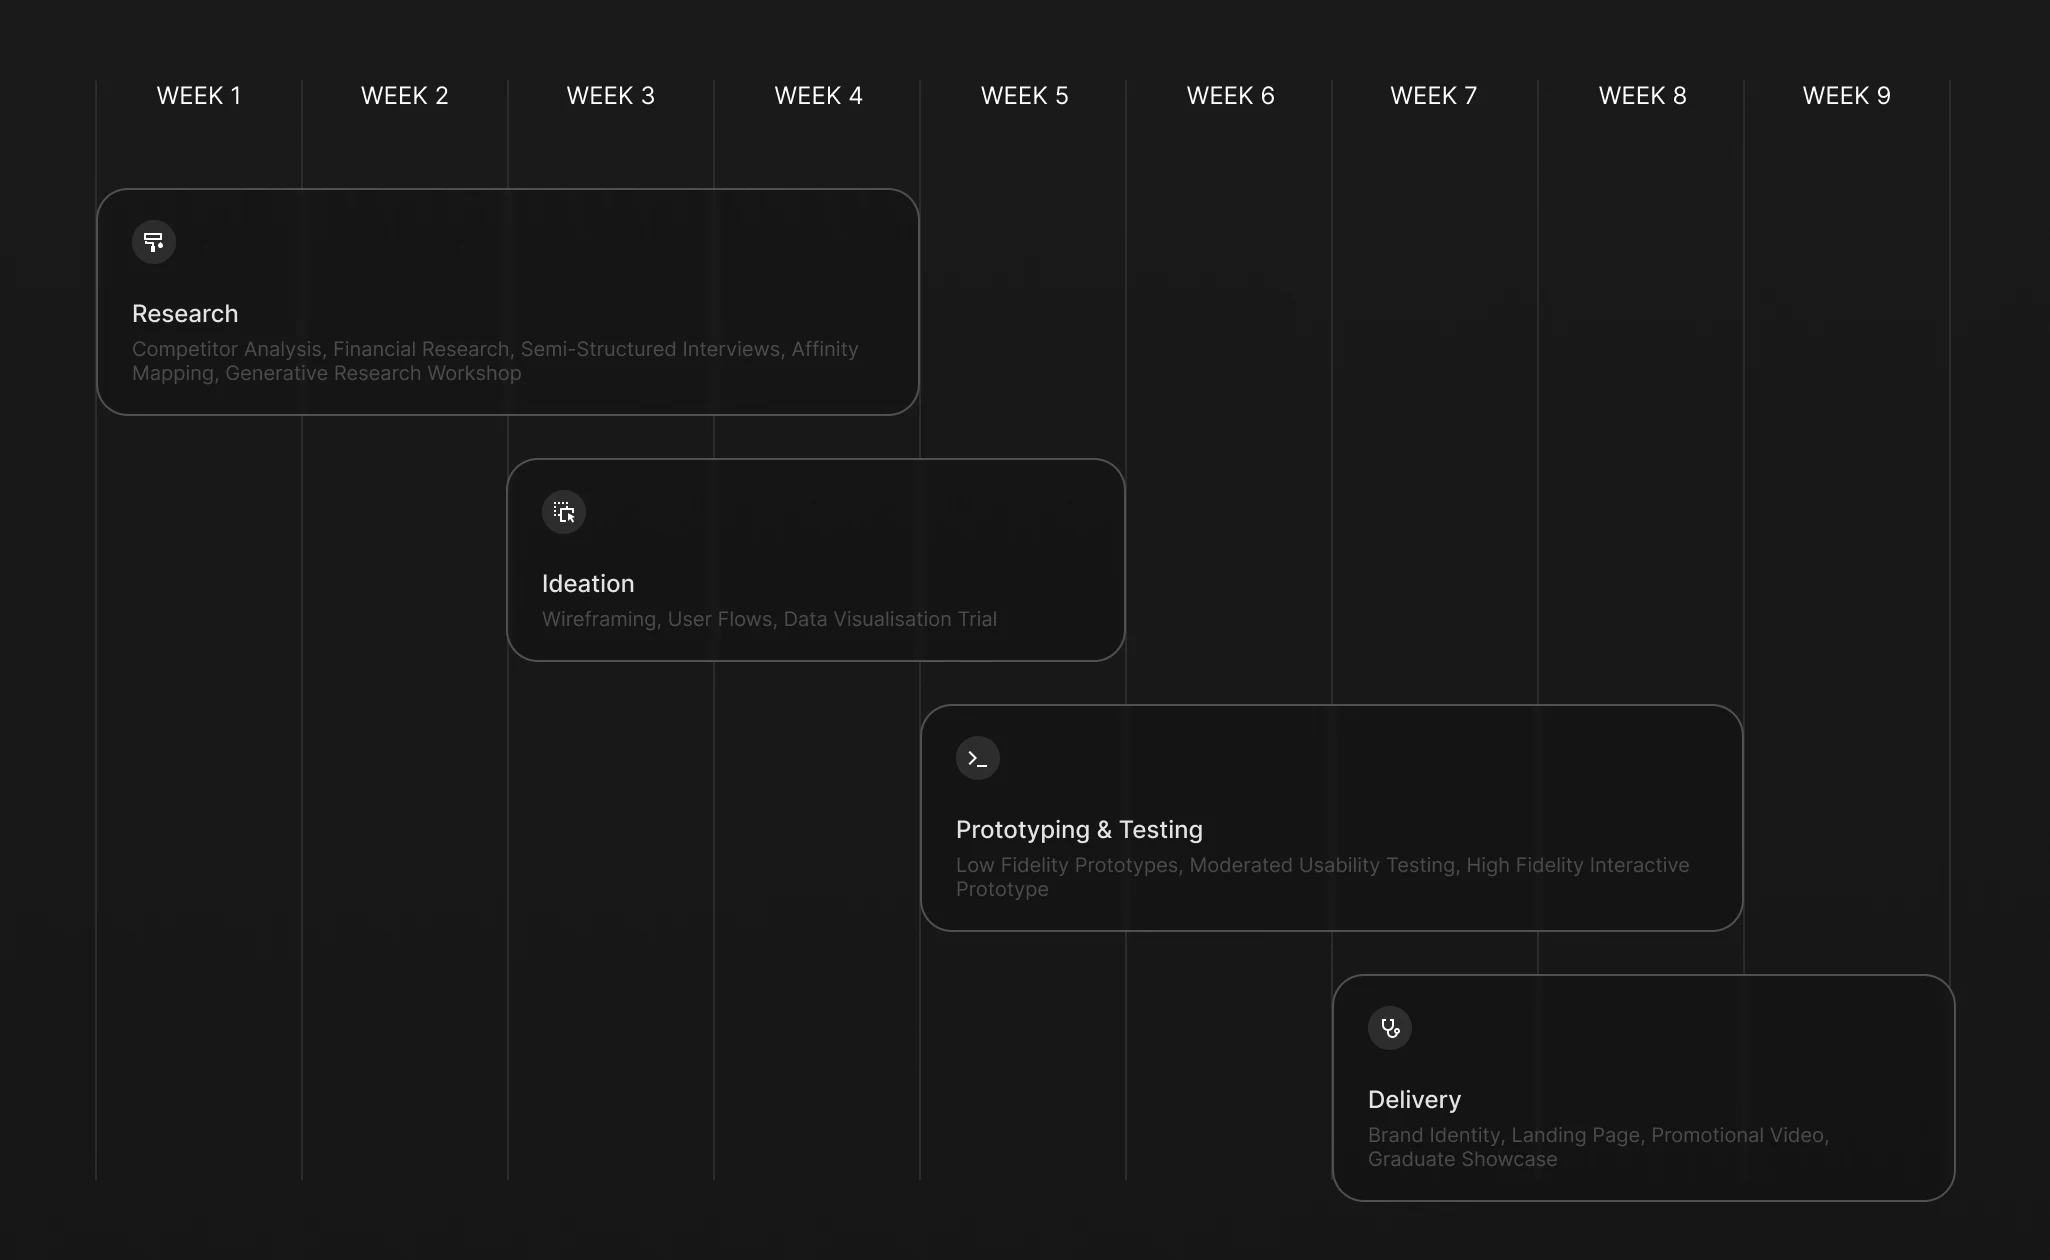
We conducted research in three stages:
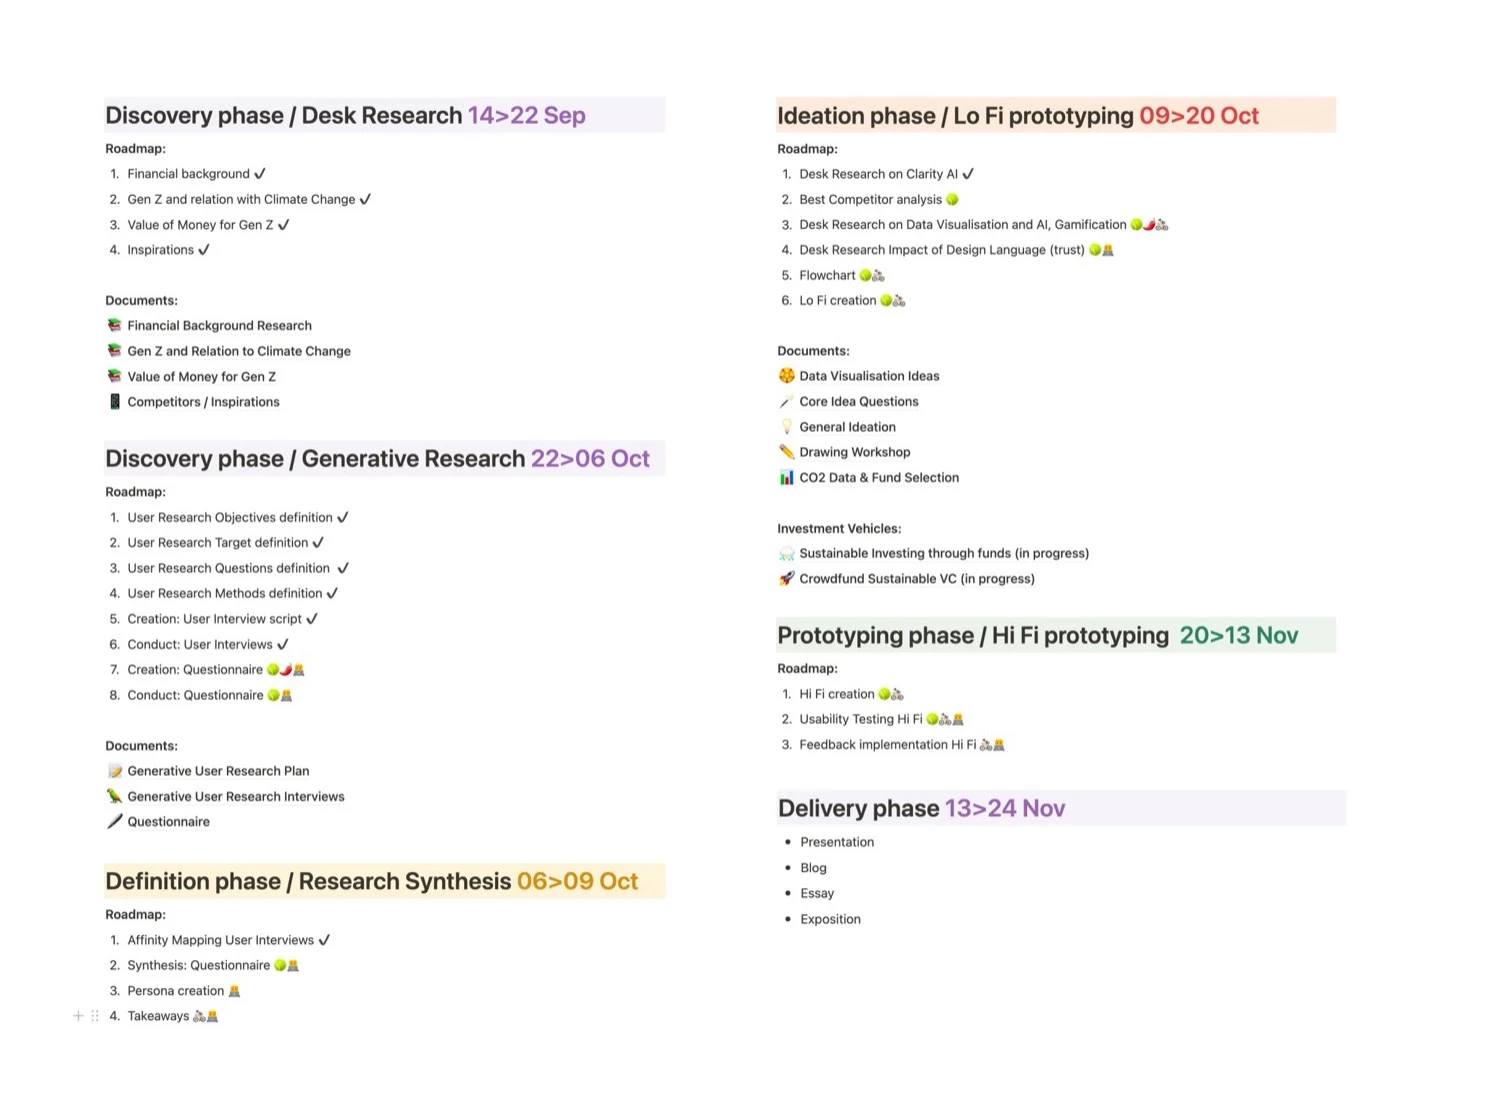
- Desk research on impact investing and our target audience
- Generative research including interviews and a drawing workshop
- Competitor analysis and data provider analysis
Desk Research
As our target audience we chose Generation Z (born between 1995 and 2010), specifically those residing in European urban centres. We found this group is driven by a number of motives in their spending and investing.
- Focus on innovation: a strong inclination towards spending on technological and design-based innovations
- Insistence on convenience: reliance on convenience, seen in preferences for time-saving devices, easy-to-acquire retail channels, and products with simplified experiences
- Desire for security: Economic challenges shape Generation Z's focus on security, leading to an interest in saving and conservative spending
We also discovered that people who care about the environment had a propensity to be less interested in or even defensive towards traditional finance. We saw this as an opportunity to shift away from the perception of traditional finance. From financial research we learned that ESG (Environmental, Social, and Governance) ratings are widely viewed as arbitrary and unreliable. We noticed however the emergence of new alternative data suppliers for sustainability data. We furthermore evaluated at a number of asset classes and ultimately decided on impact funds as the investing vehicle.
Generative Research
We created a comprehensive research plan detailing the questions we aimed to answer. Based on those questions, we decided on in-depth interviews and a workshop as choice of methodology. With advisory help of a senior UX researcher at travel platform eDreams we reviewed our research plan and updated our interview script according to his remarks.
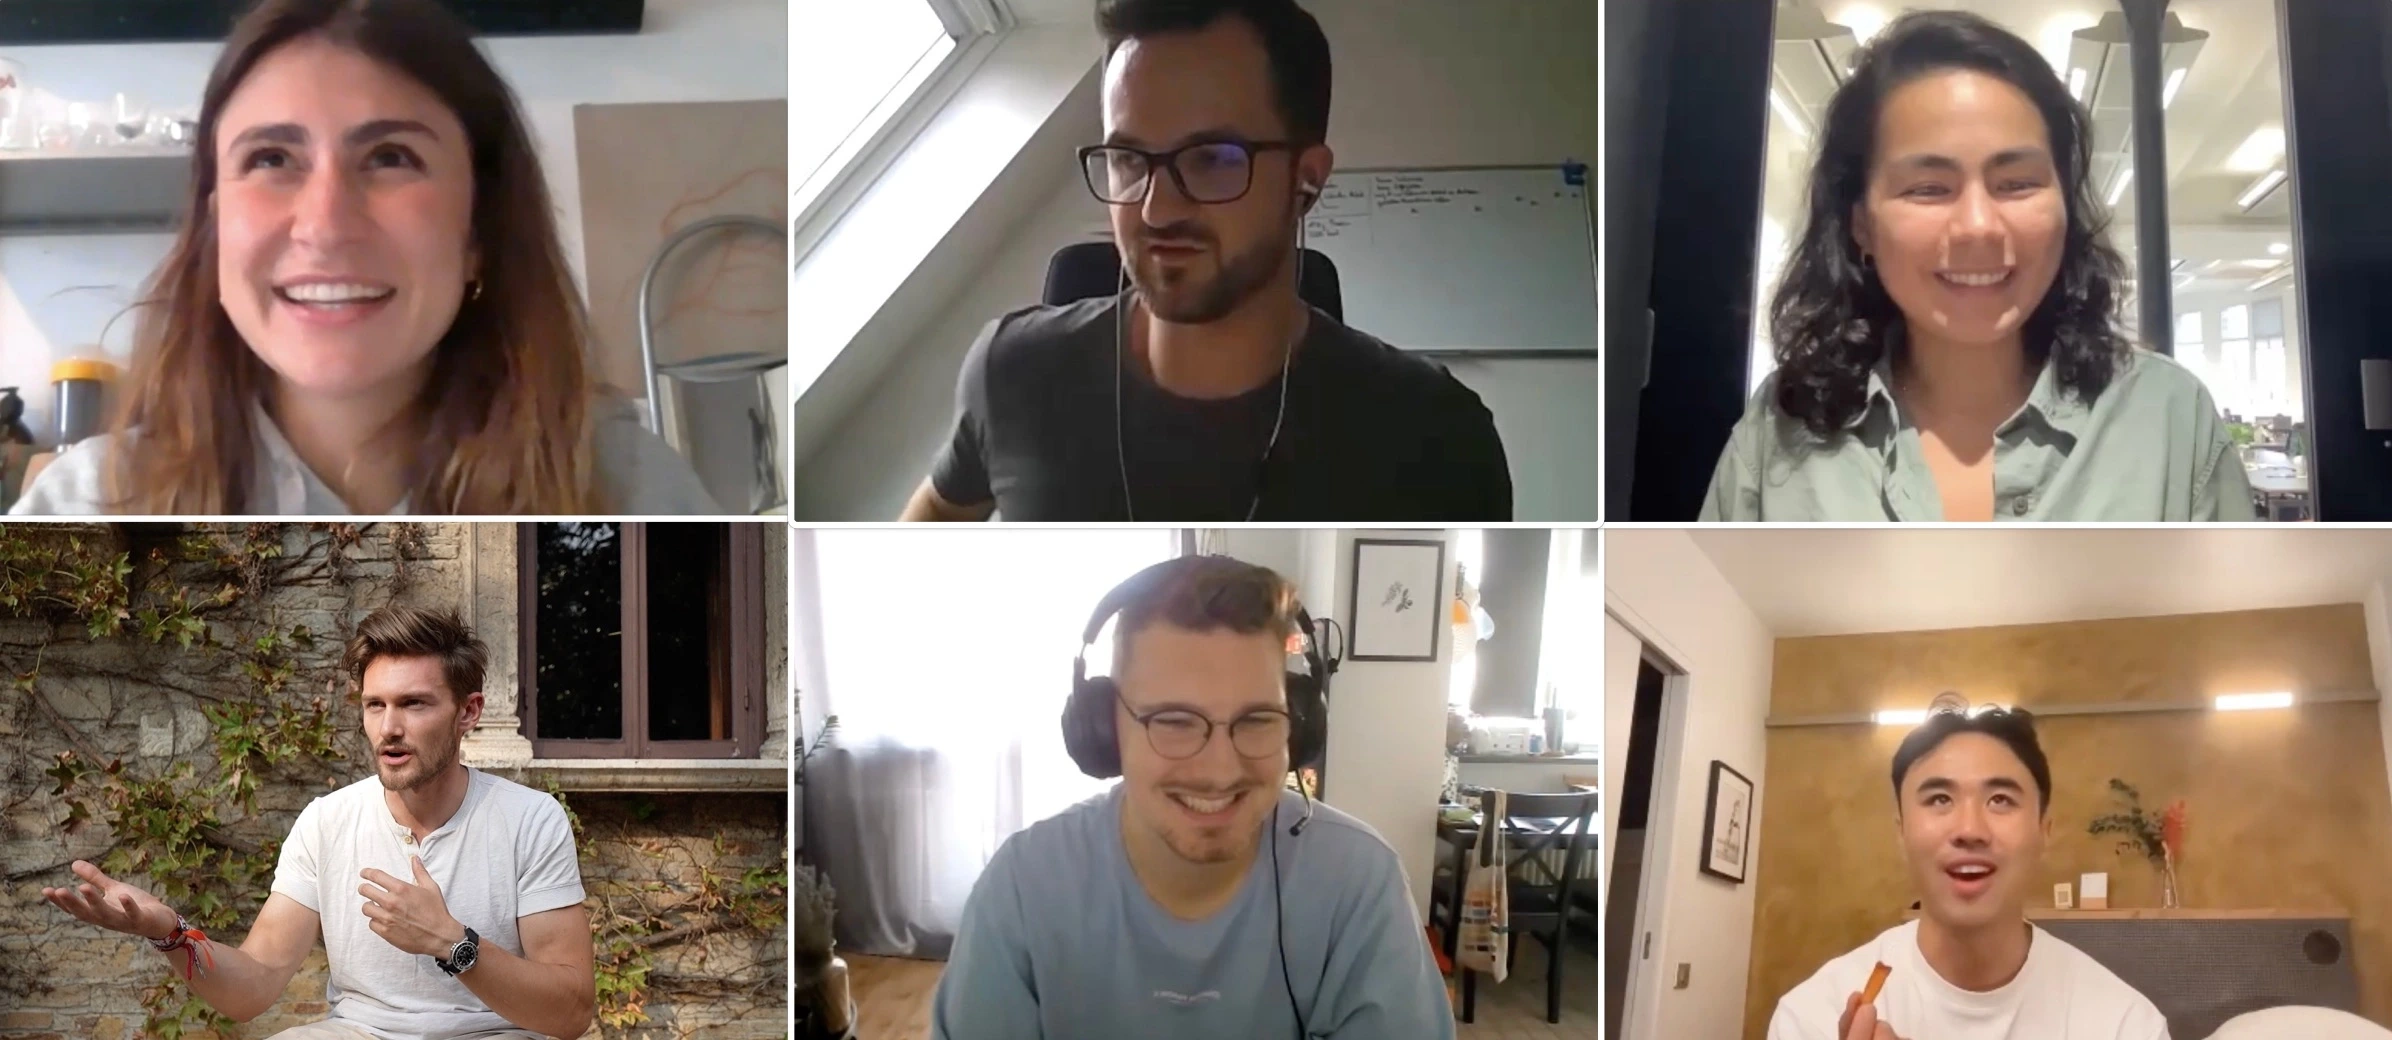
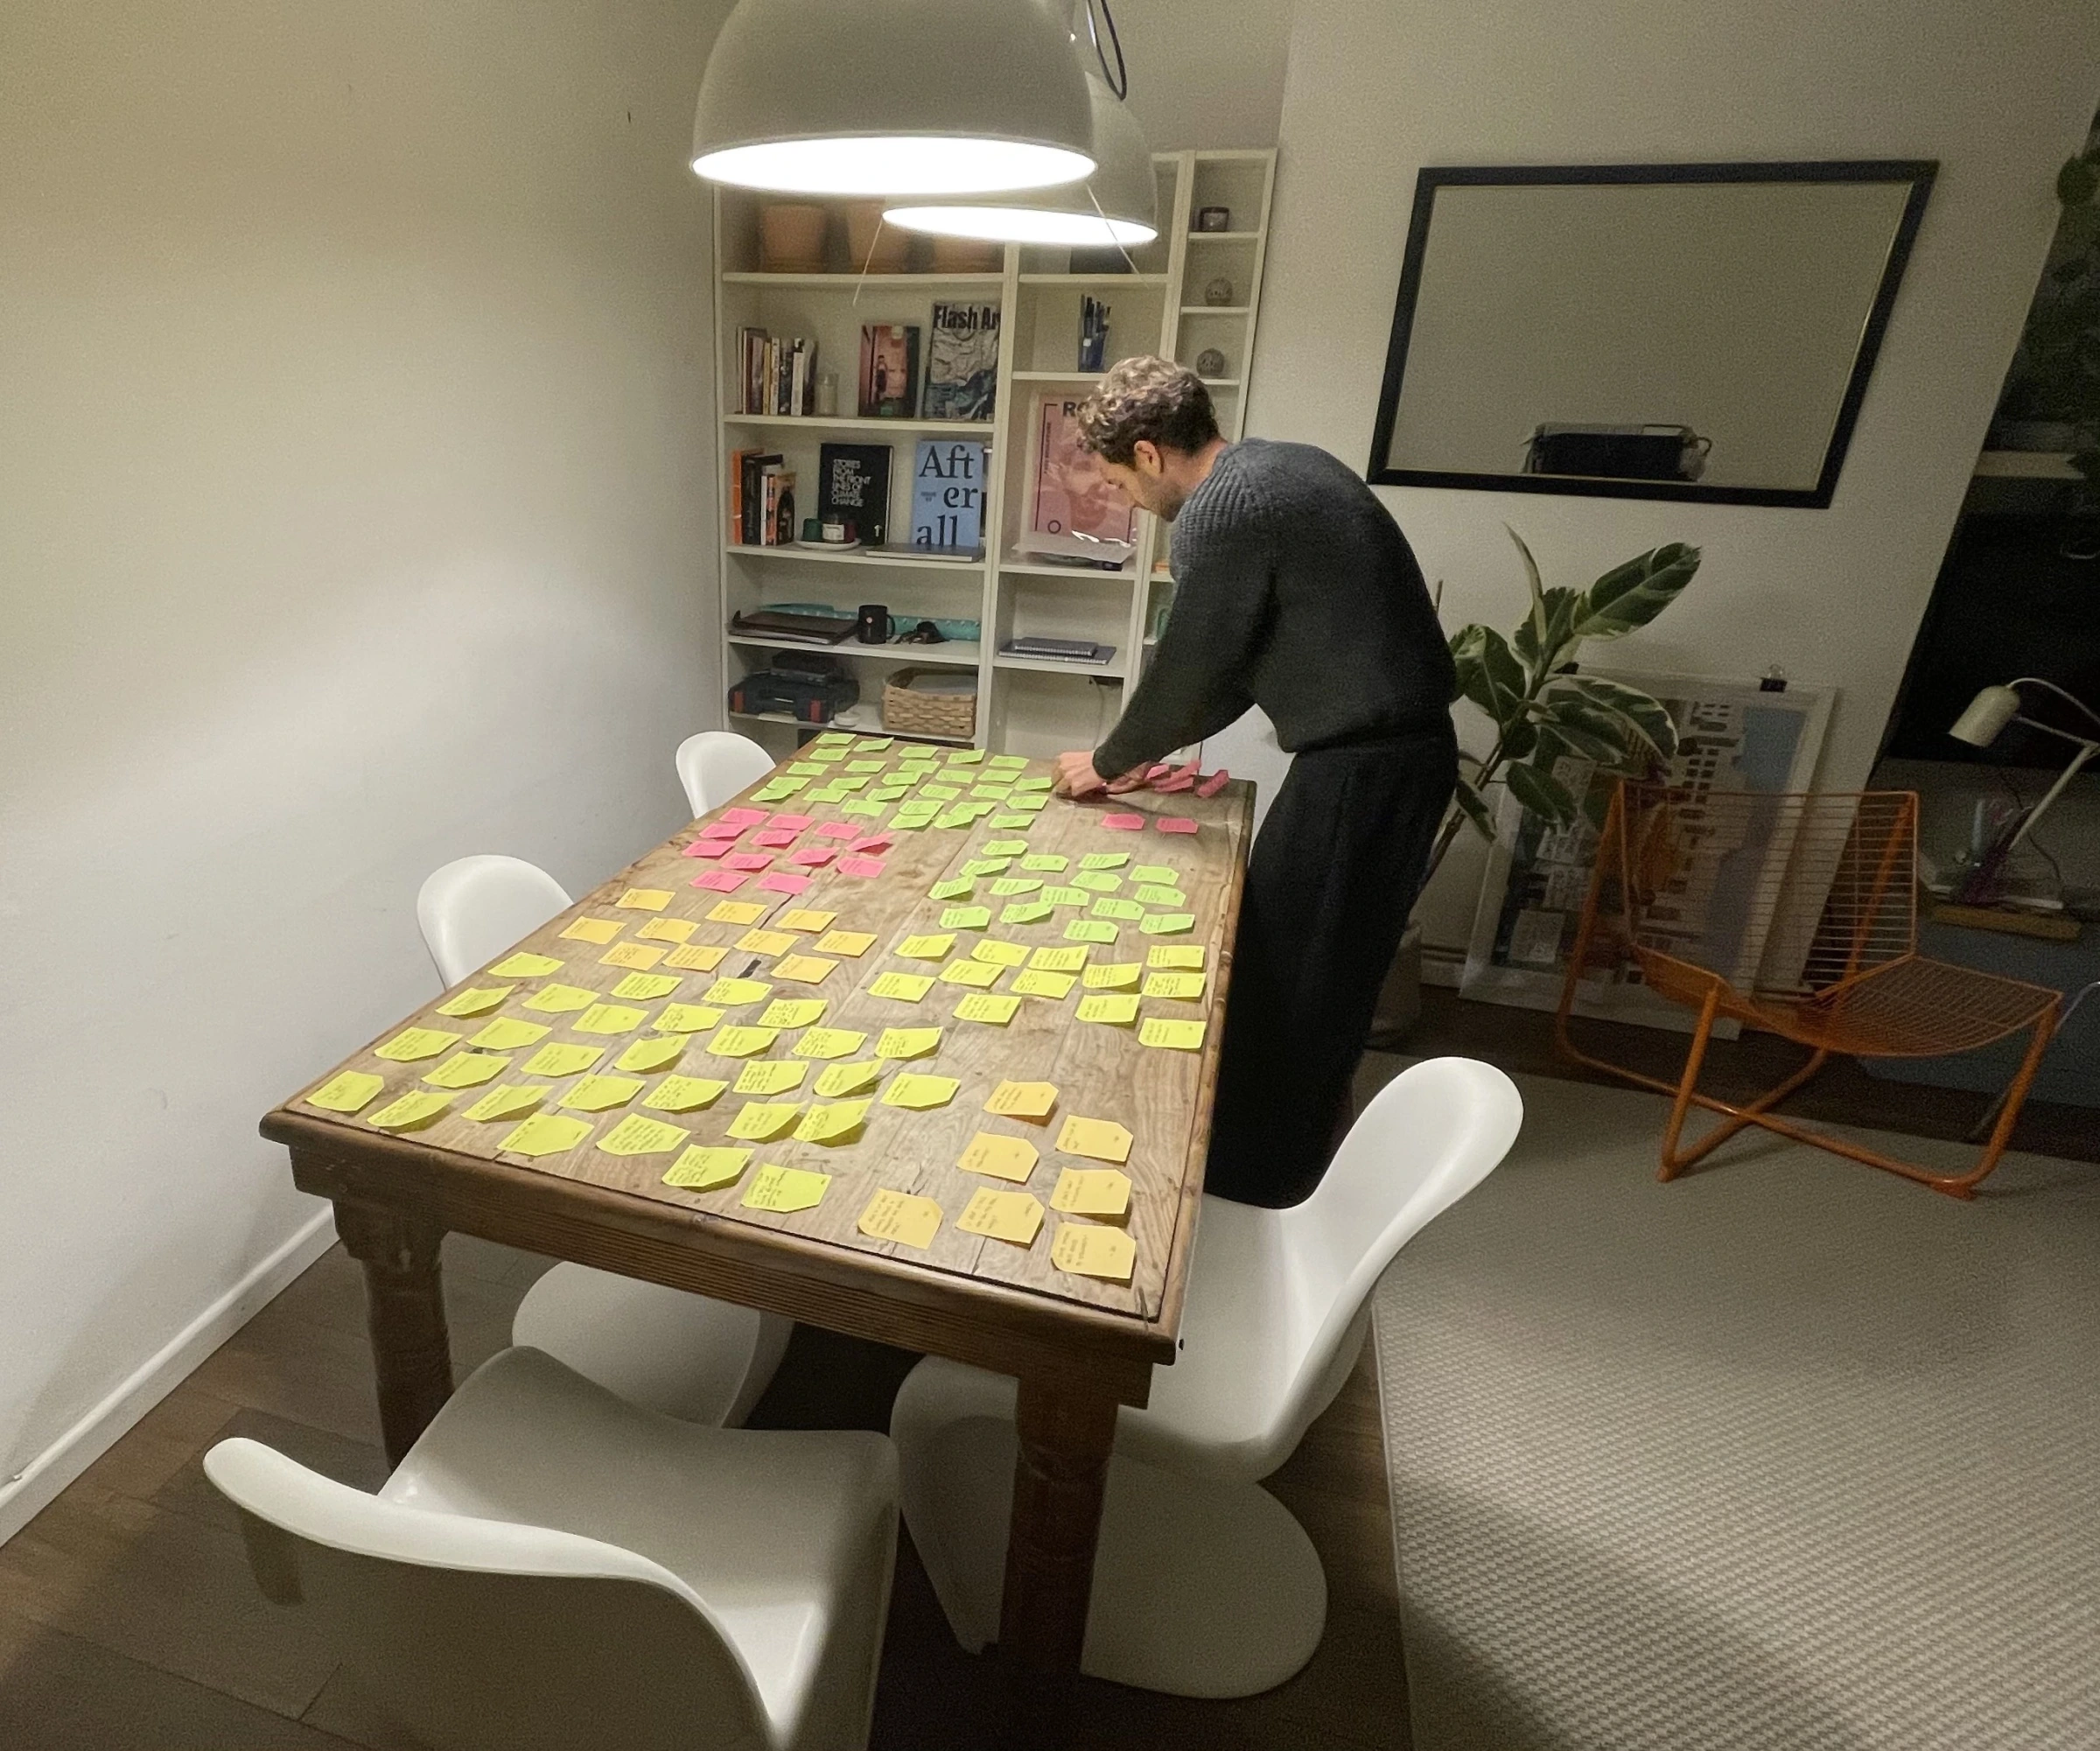
Ten individuals from five different nations were interviewed for 20 to 45 minutes. We used affinity mapping and thematic analysis to conceptualise the results.
Key findings included:
- Participants struggled to see their impact in the context of the larger picture
- Impact investing was not on participants’ minds as much as every day eco-friendly behaviour
- Key barriers to investing are perceived insufficient wealth and perceived overwhelming complexity
- Generation Z highly value convenience in investing
- There is a strong sense of guilt associated with climate change
Drawing workshop
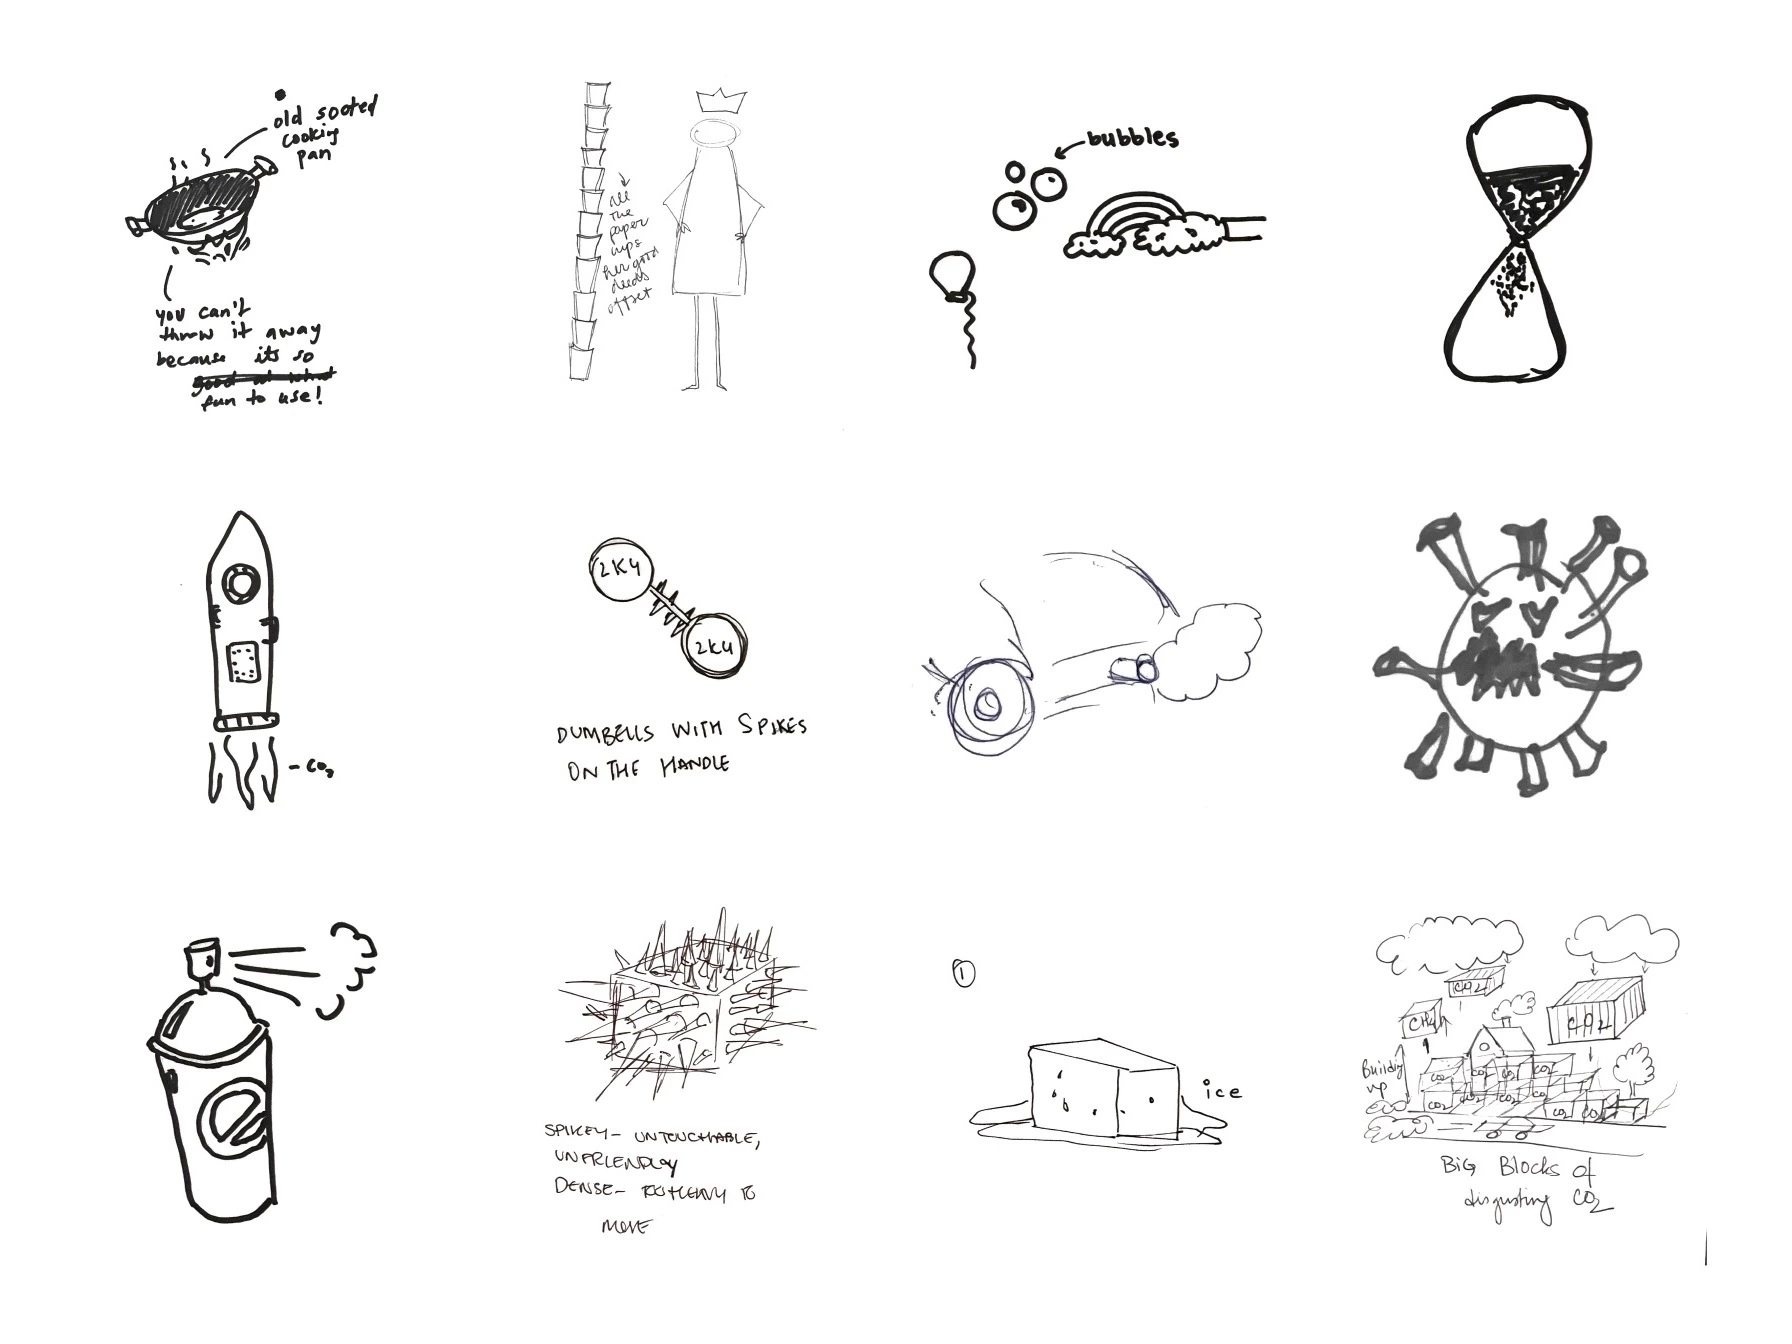
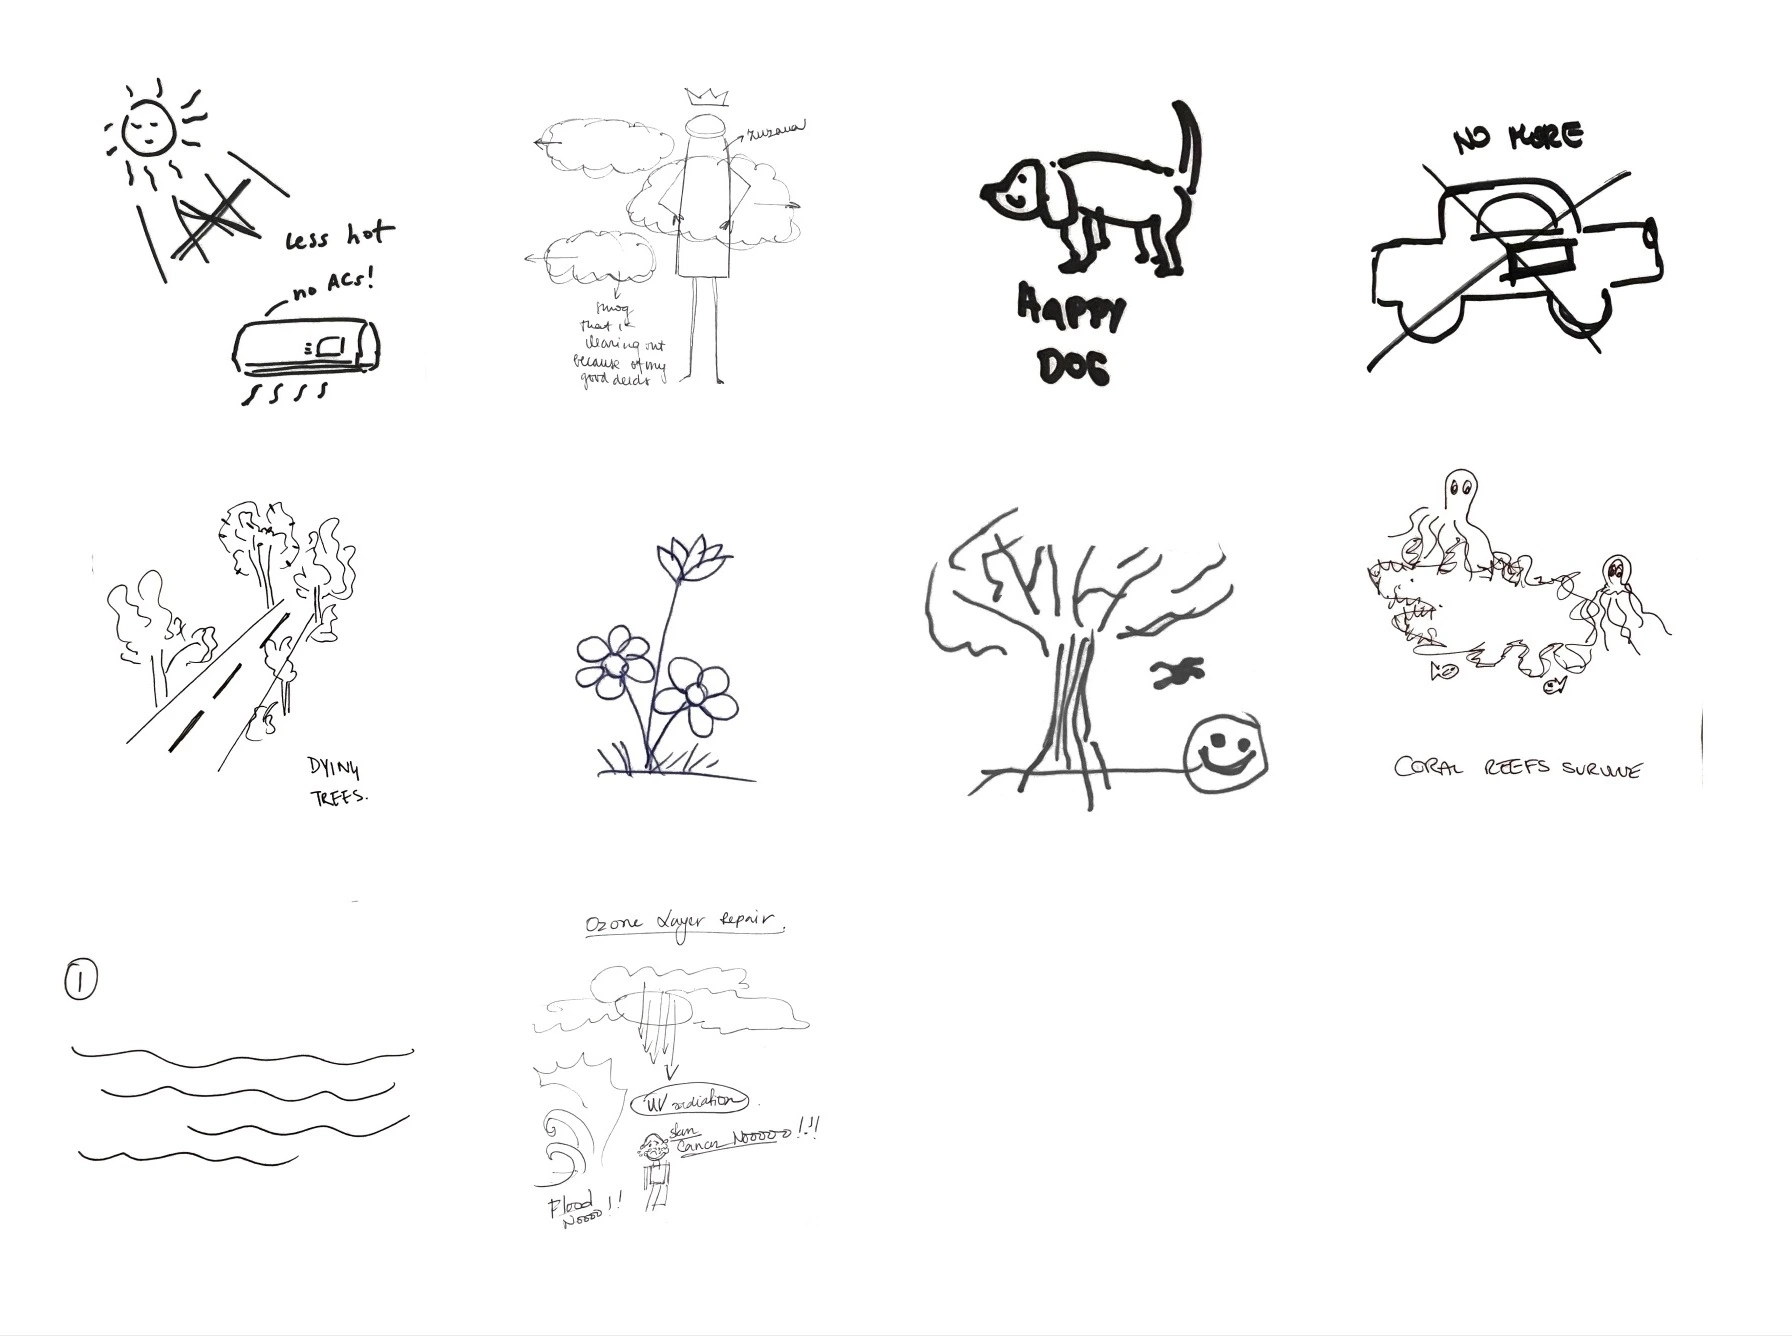
In order to gather people's associations with CO2 emissions, we held a drawing workshop. This was meant to assist us in coming up with concepts for the visualisation. We invited 12 individuals from 12 different countries—half from Asia and the other half from Europe— to sketch their first ideas for the following questions: If CO2 Emissions were an object, what would they be? What could be one consequence of reducing CO2 emissions?
Ideation
Ideation
Exploring data visualisation and investing UX
Following conceptualisation of the research, we chose to focus on people who were already concerned about climate change but were not familiar with finance, since we deemed it difficult to engage typical investors who are primarily motivated by profit maximisation. This meant that we would lower the financial entry barrier and focus on a strong visual storytelling component with our impact visualisation.
In order to minimise the entrance barrier, we choose to use an automated portfolio that is based on simple user preferences, akin to a robo-advisor. In terms of customizability, we disagreed in a few areas as we tried to strike the ideal balance between the sense of ownership that comes from having created our own portfolio and the confusion and anxiety that comes with too much complexity.
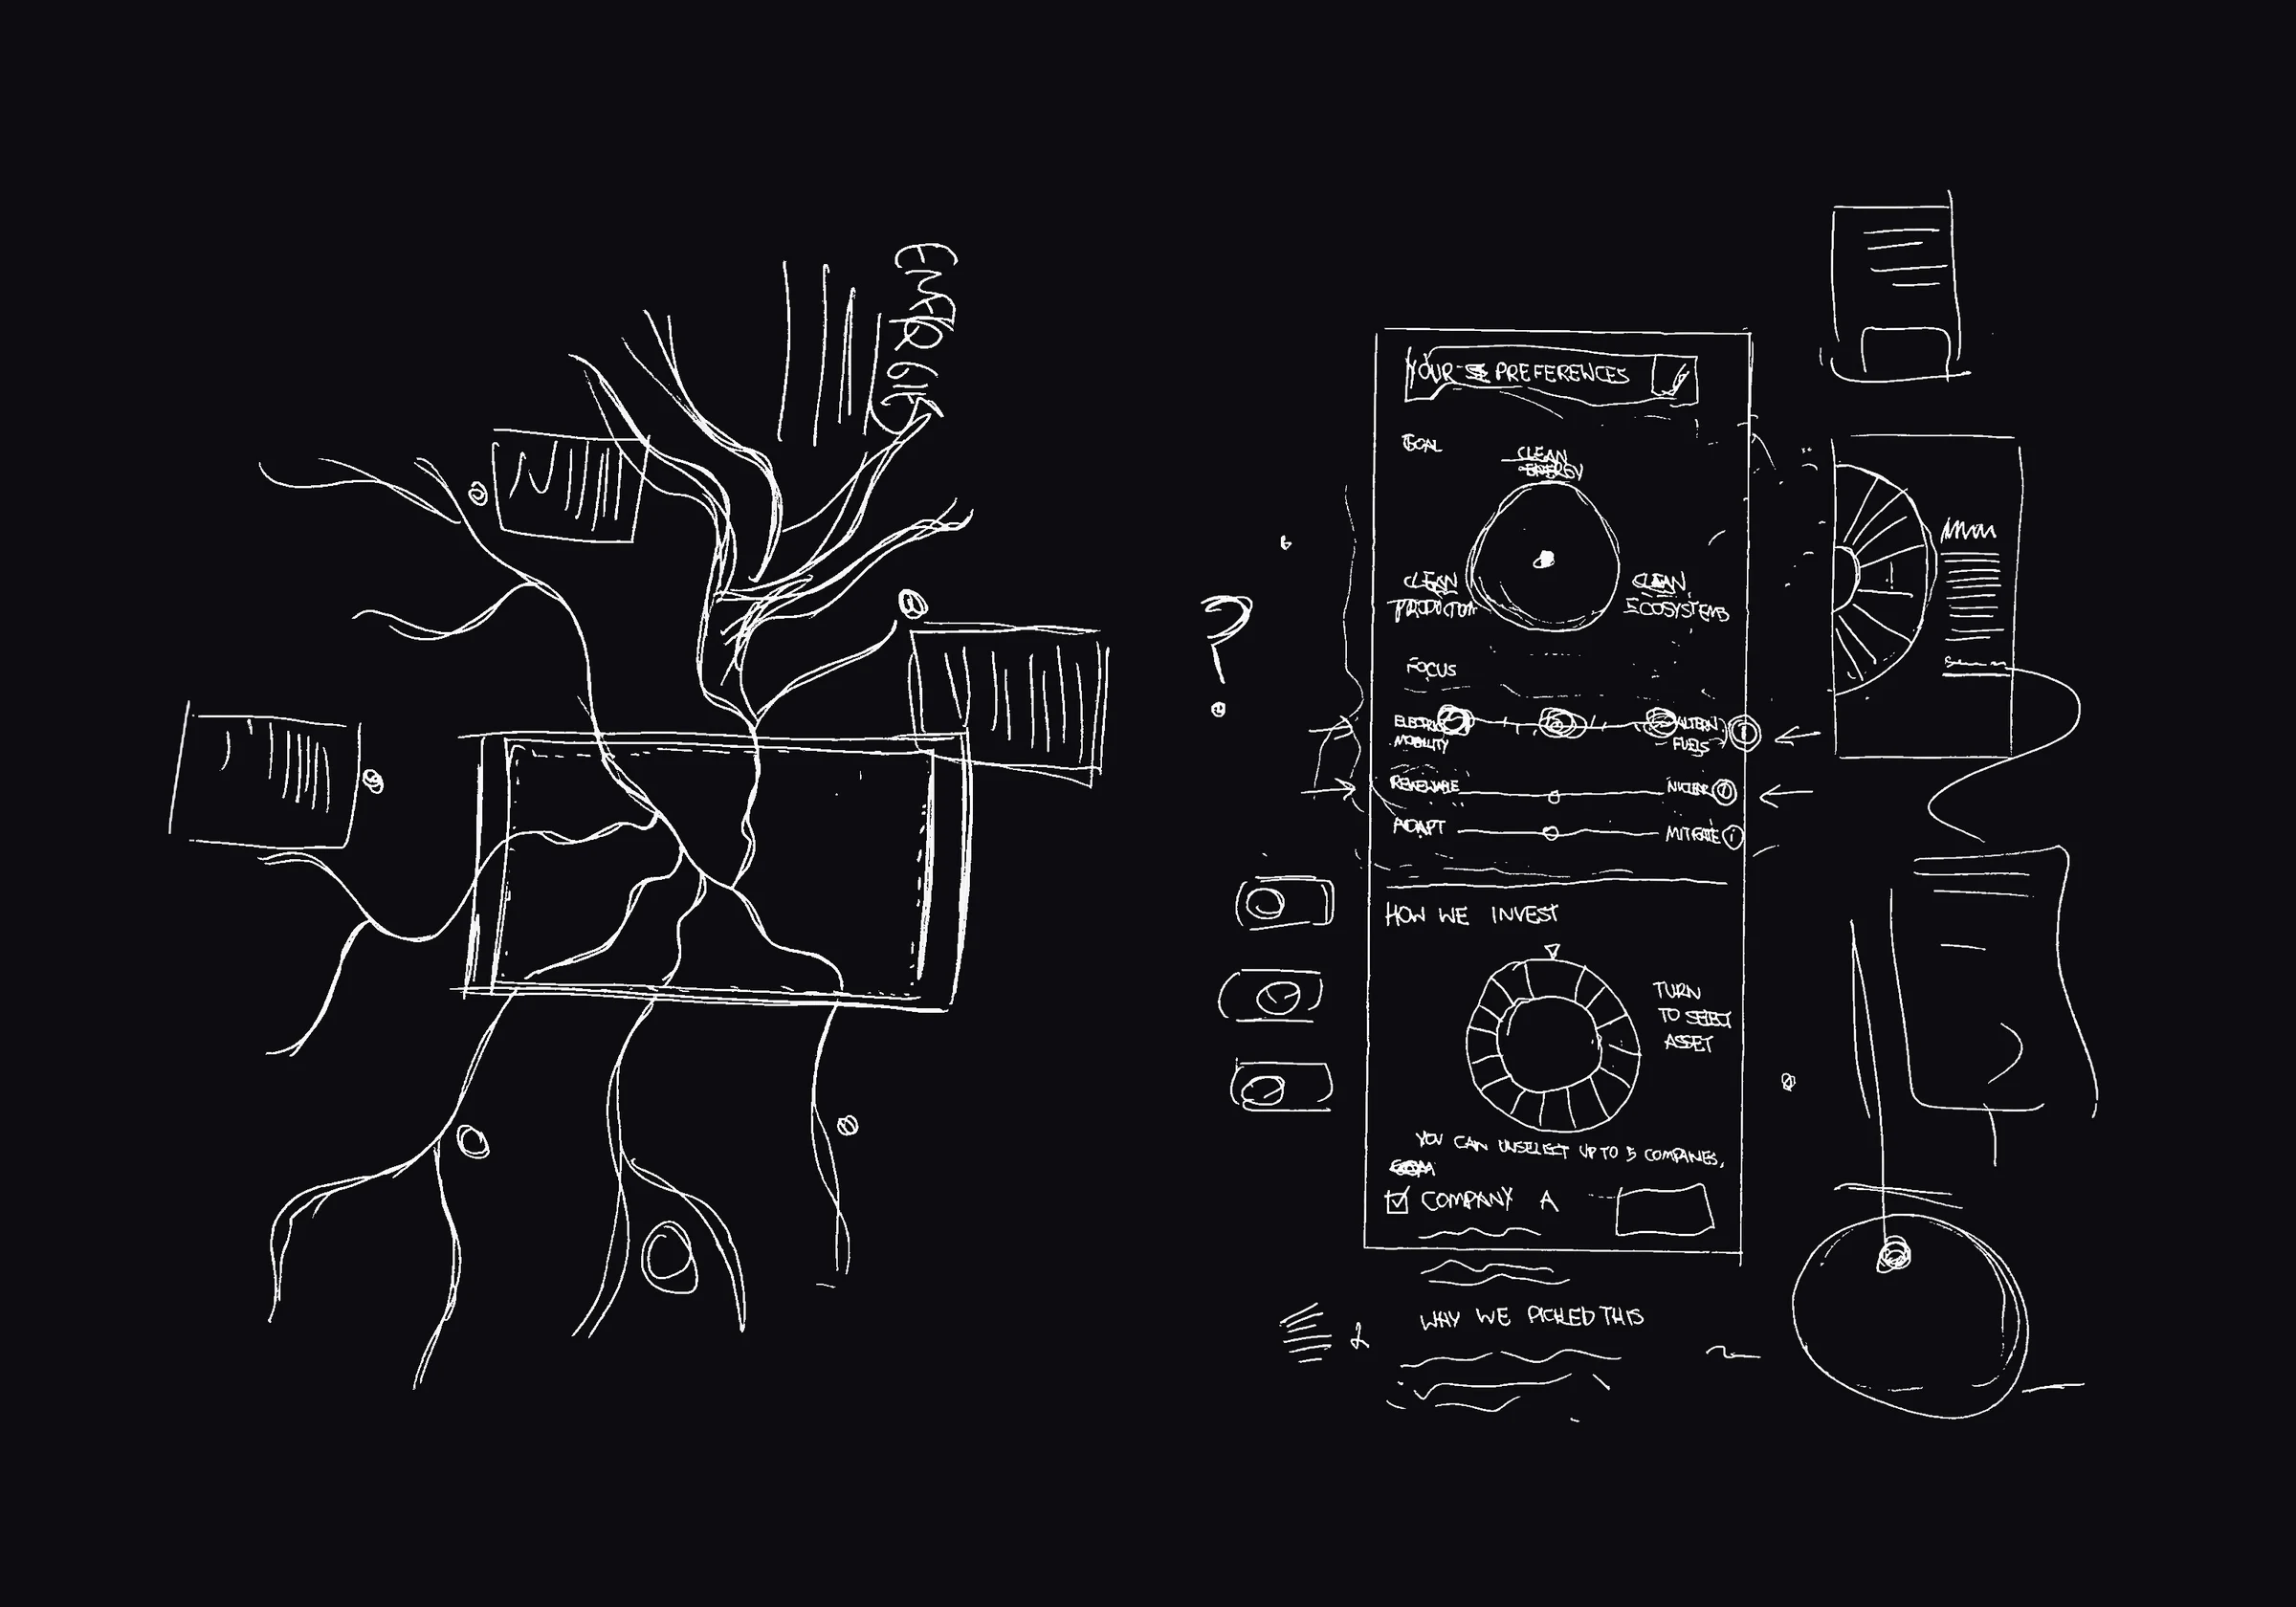
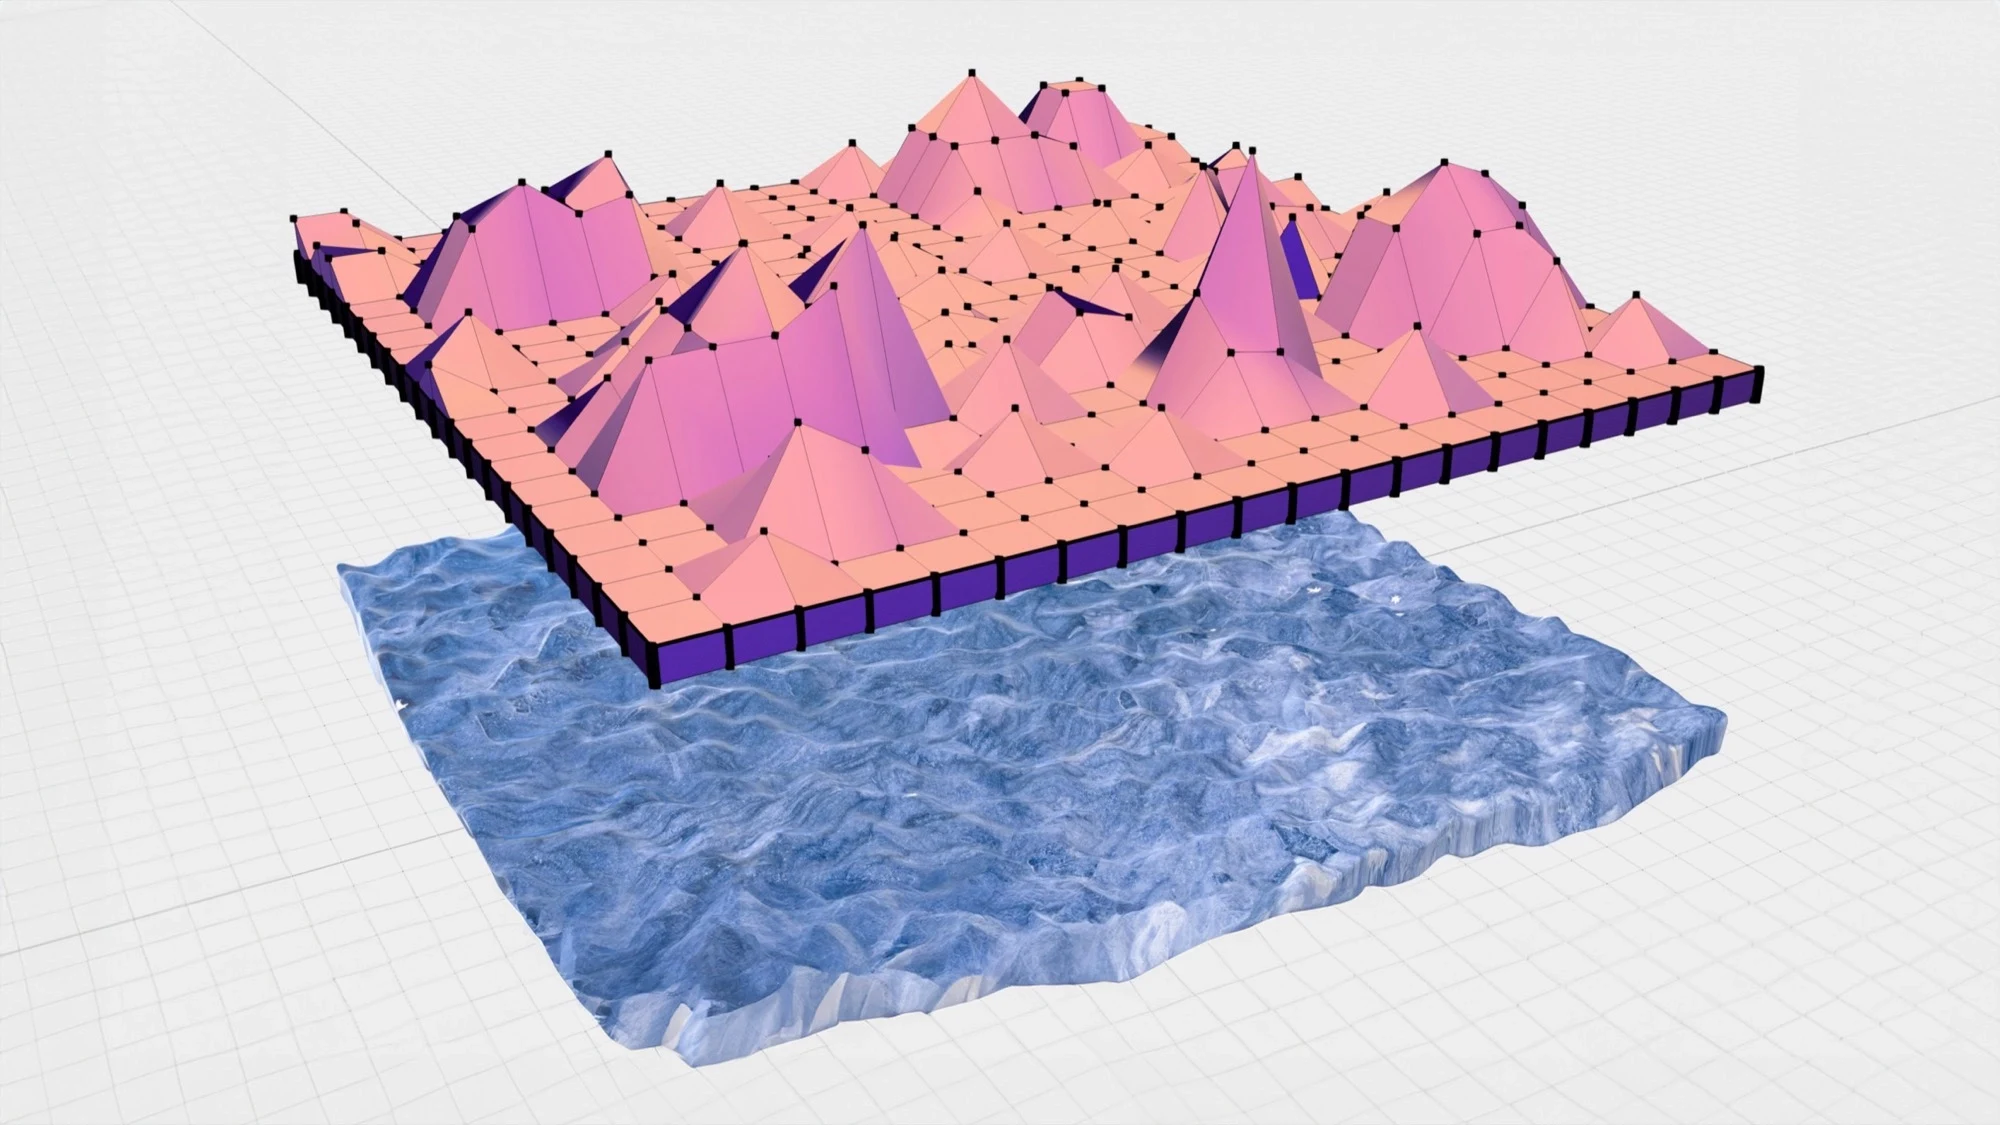
To visualise impact, we used inspiration from the drawing workshop. Initially we considered showing the volume of reduced CO2 in balloons. A green investment of $5000 for instance could be equivalent to the reduction of 8300 balloons CO2 yearly. We pivoted to Arctic ice as visualisation after finding it elicited a more emotional reaction and was easier to comprehend for our test subjects. The fact that a transatlantic return flight decreases the expanse of September Arctic Sea ice by about 2-3 m2 per passenger was surprising to most.
I was glad to pull from earlier financial research to access preliminary data. Assuming that money left in users bank accounts would be invested conventionally, we could now calculate a CO2 reduction for every dollar moved to “Glace”. For this we used the findings from:
- Notz, D., & Stroeve, J. (2016). Observed Arctic sea-ice loss directly follows anthropogenic CO2 emission. Science, 354(6313), 747-750.
Prototyping & Testing
Prototyping & Testing
Building prototype and augmented ice visualisation
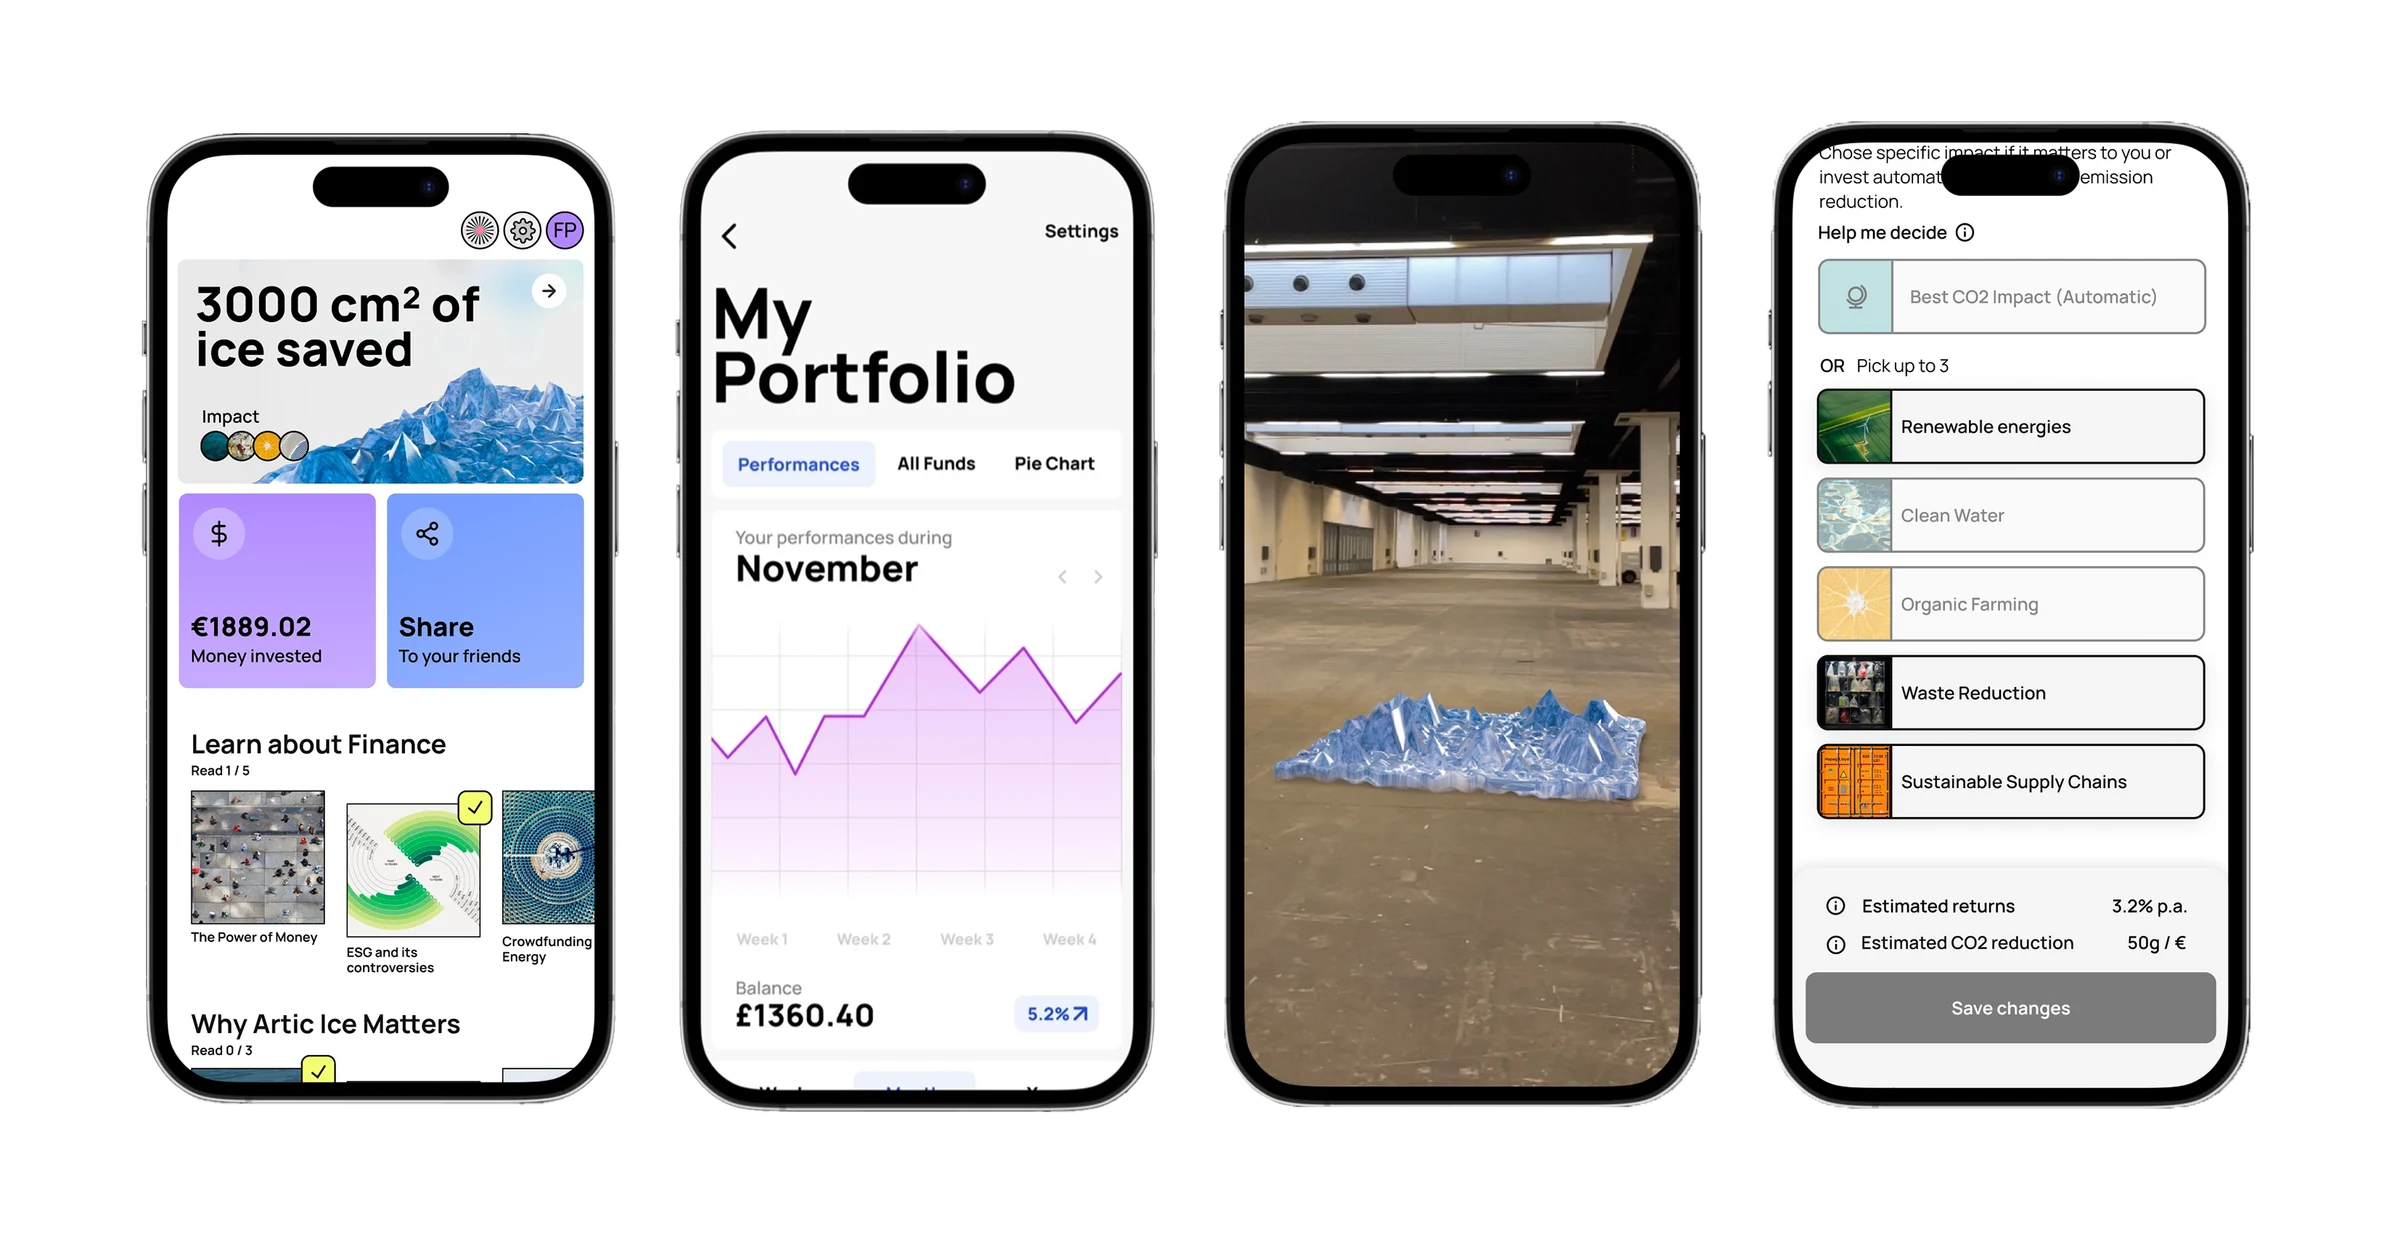
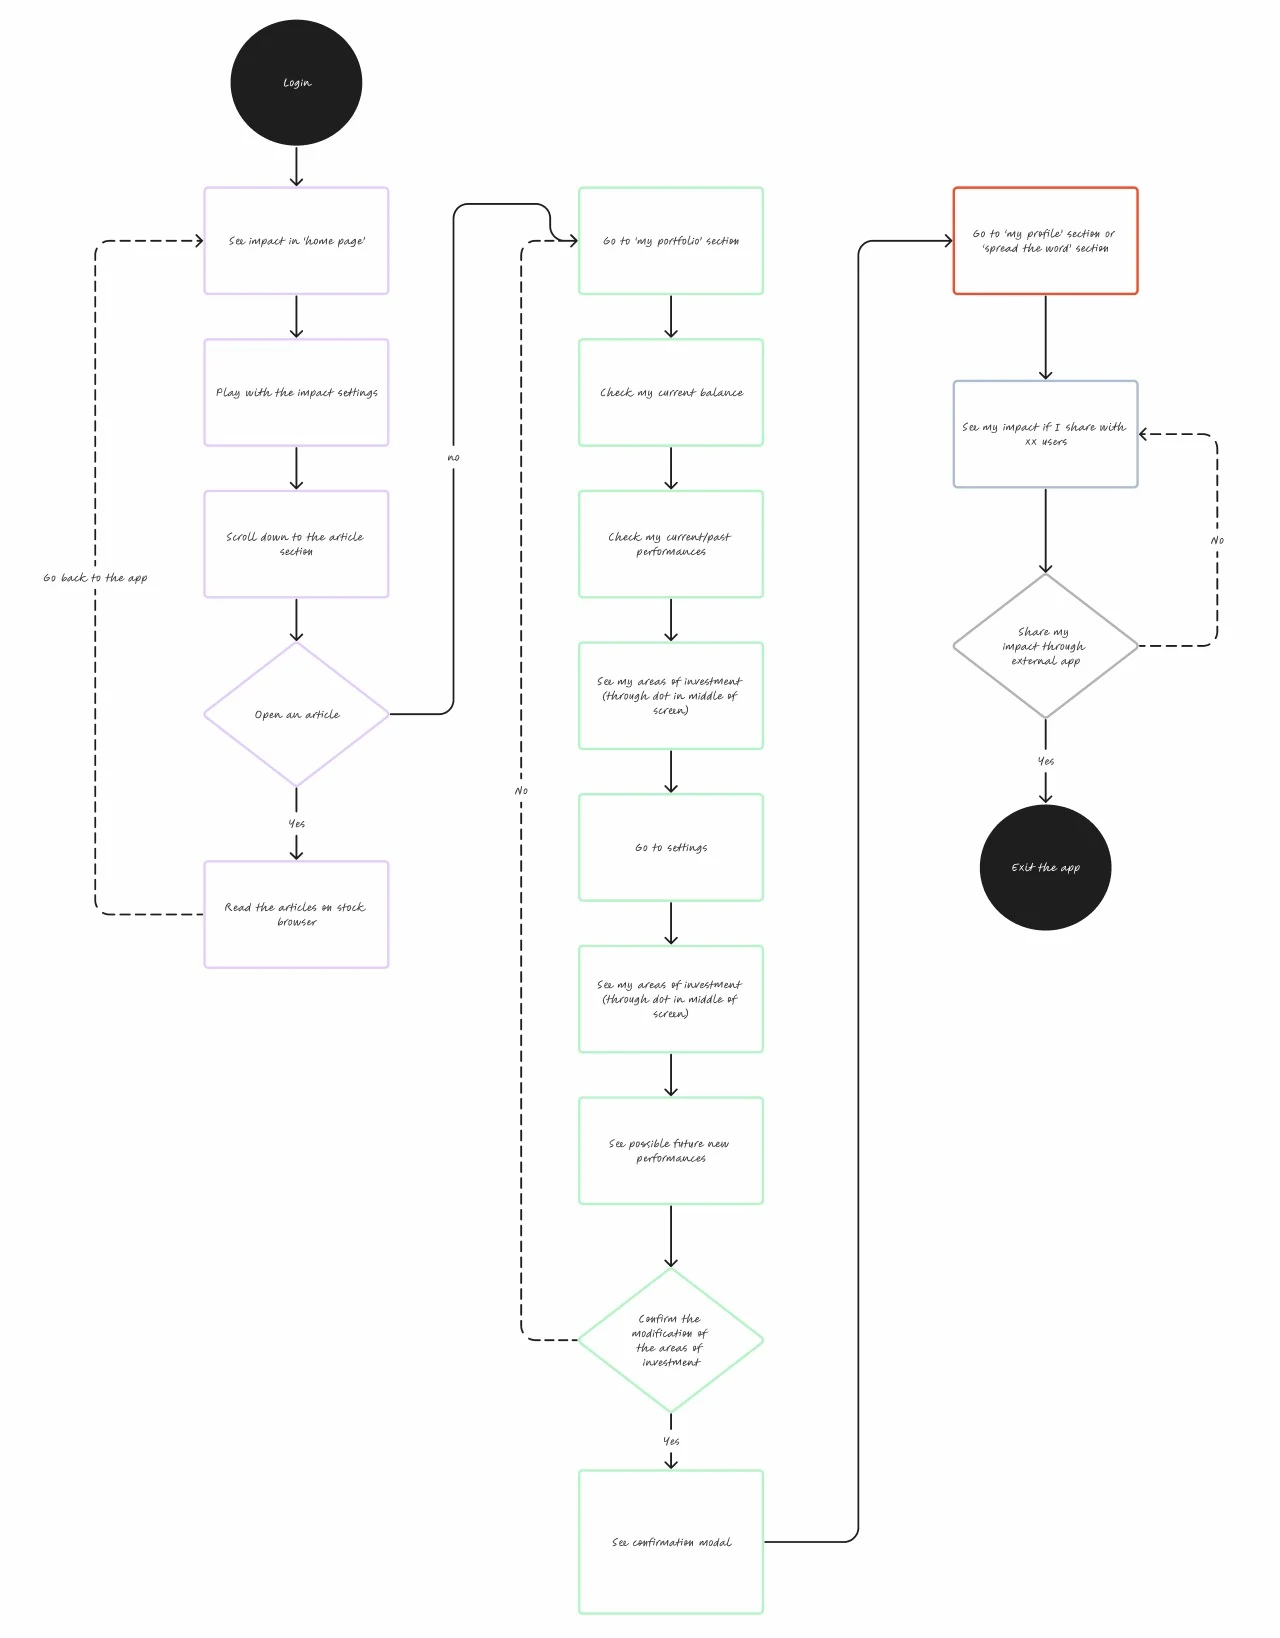
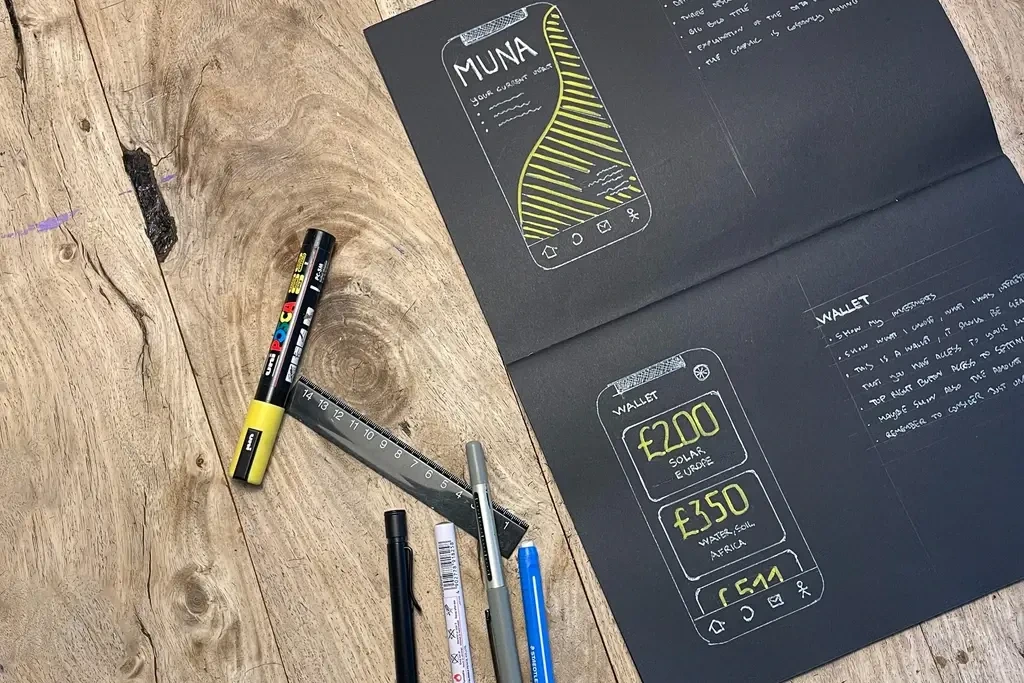
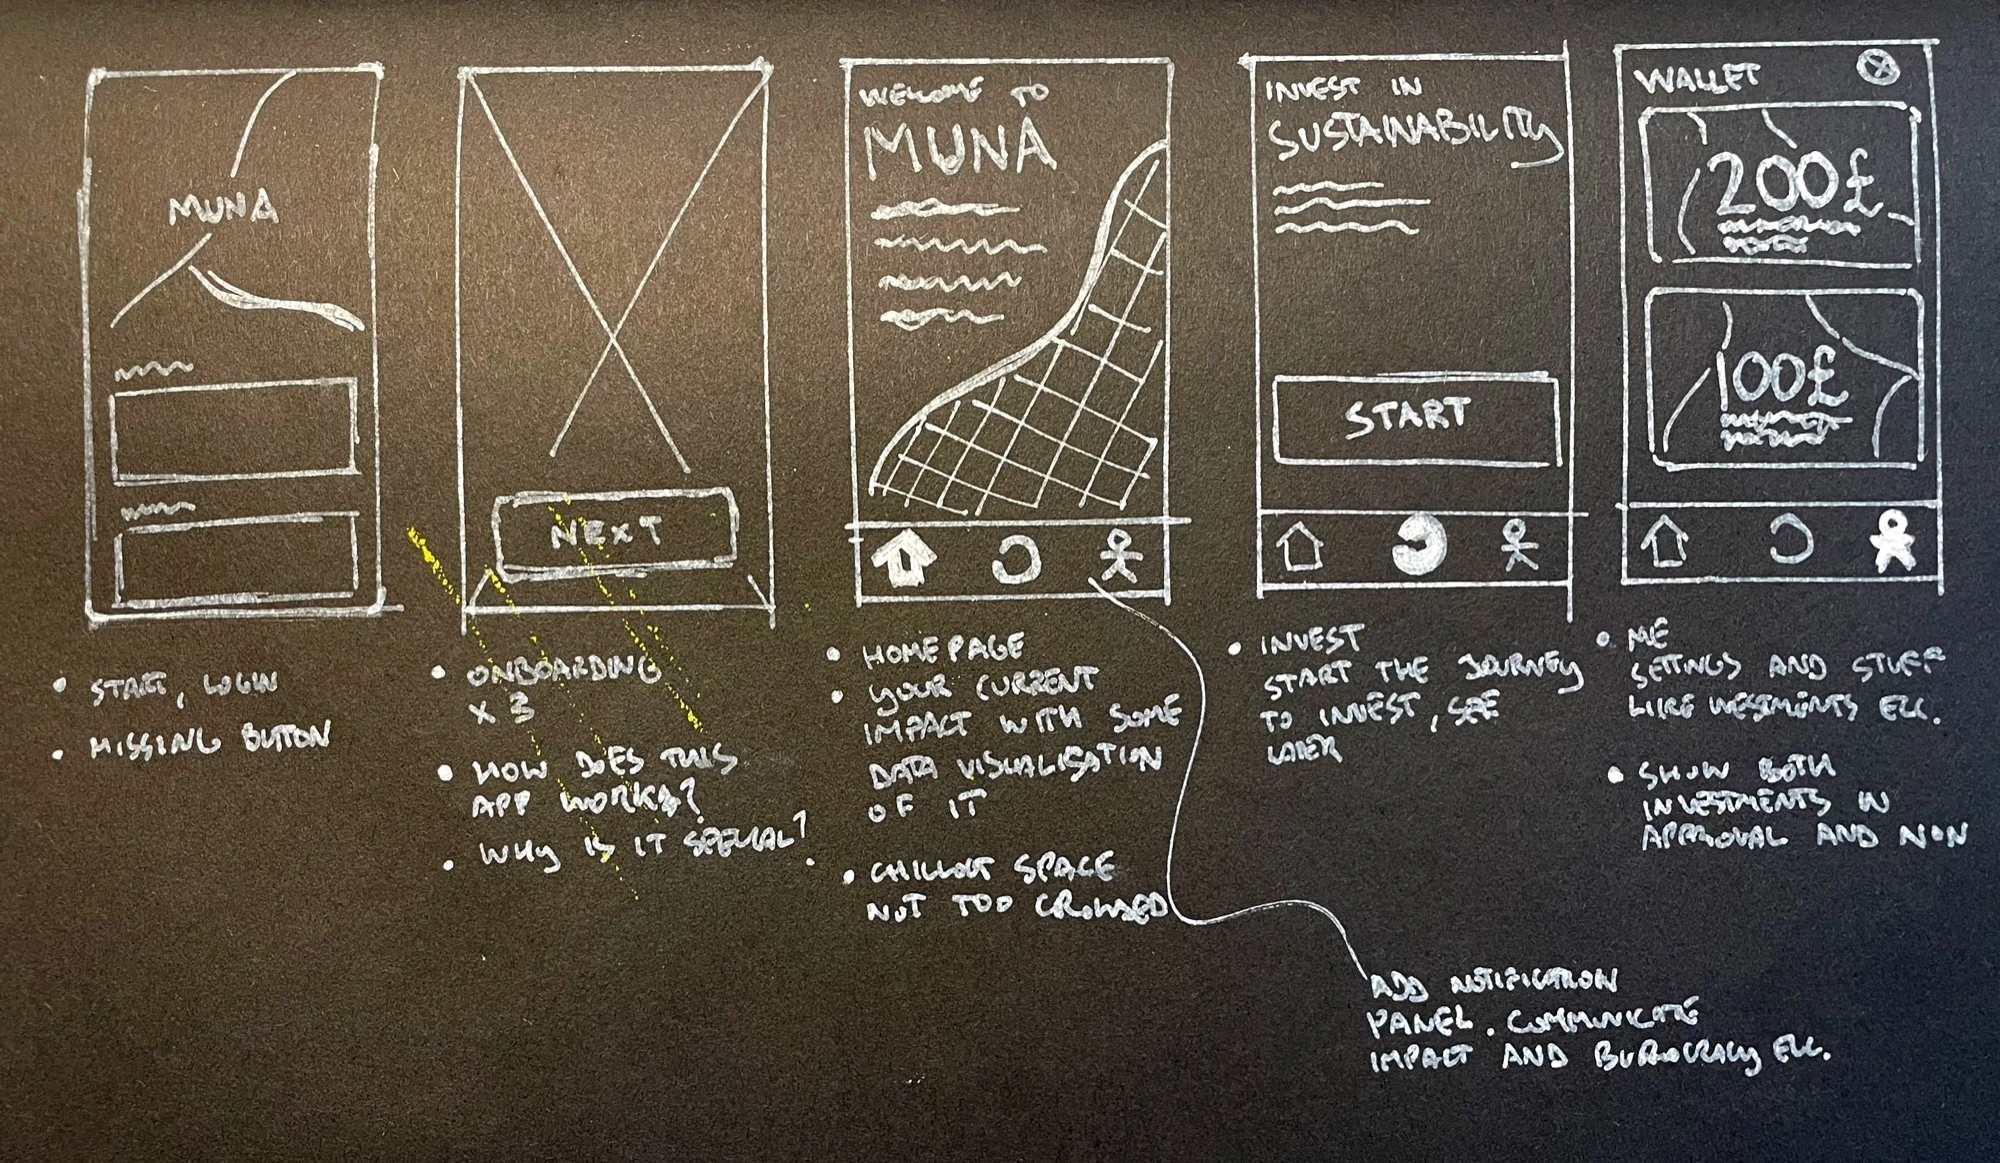
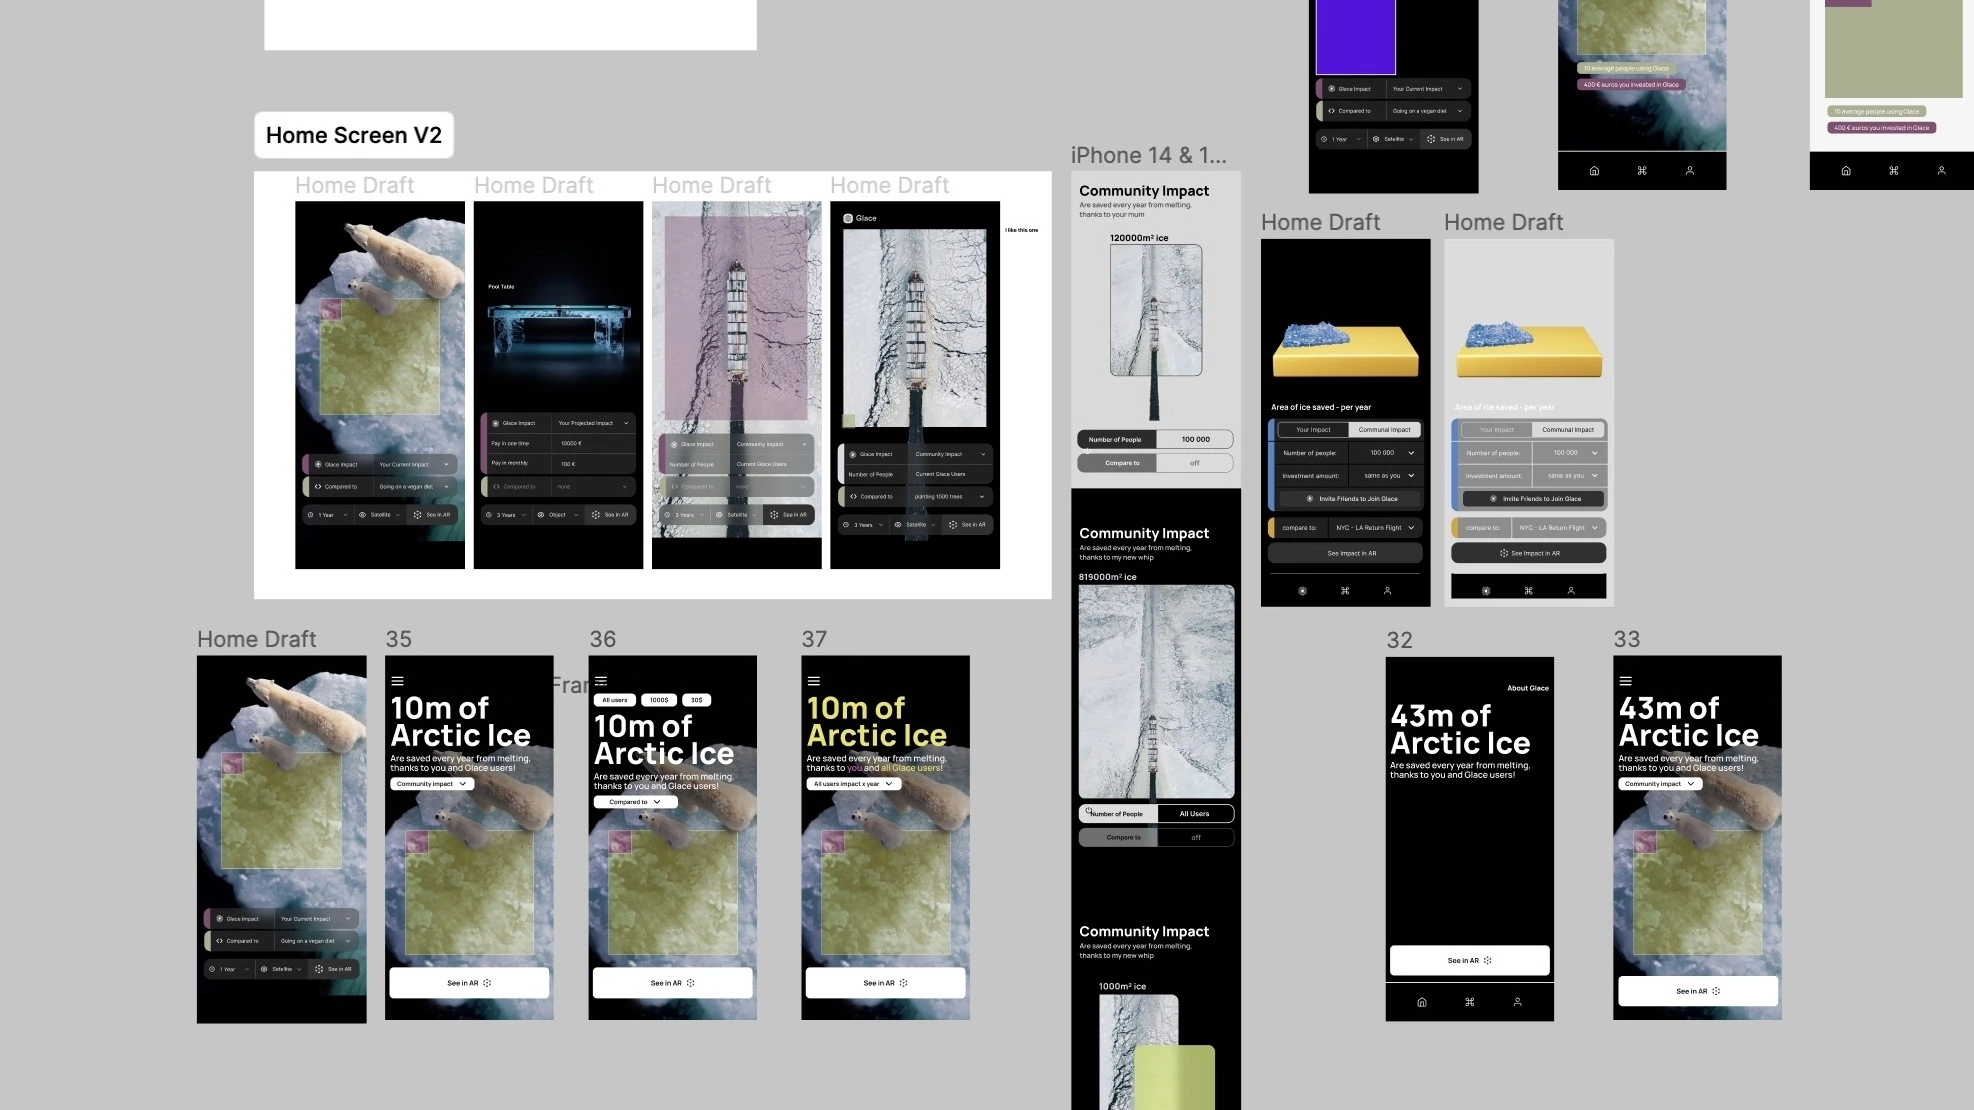
We developed flow diagrams to determine the initial information architecture in the app and started wireframing a three or four tab structure. The first screen would focus predominantly on impact instead of financial return. We anticipated a challenge in keeping users engaged with the impact and a potential sense of guilt if they consistently bypassed it to access performance data. We refined the structure with low fidelity prototypes in Figma, evaluating various methods of user customisation, impact visualisation and portfolio presentation. We experimented with mobile devices’ haptic feedback to improve the UX of portfolio interactions.
Testing
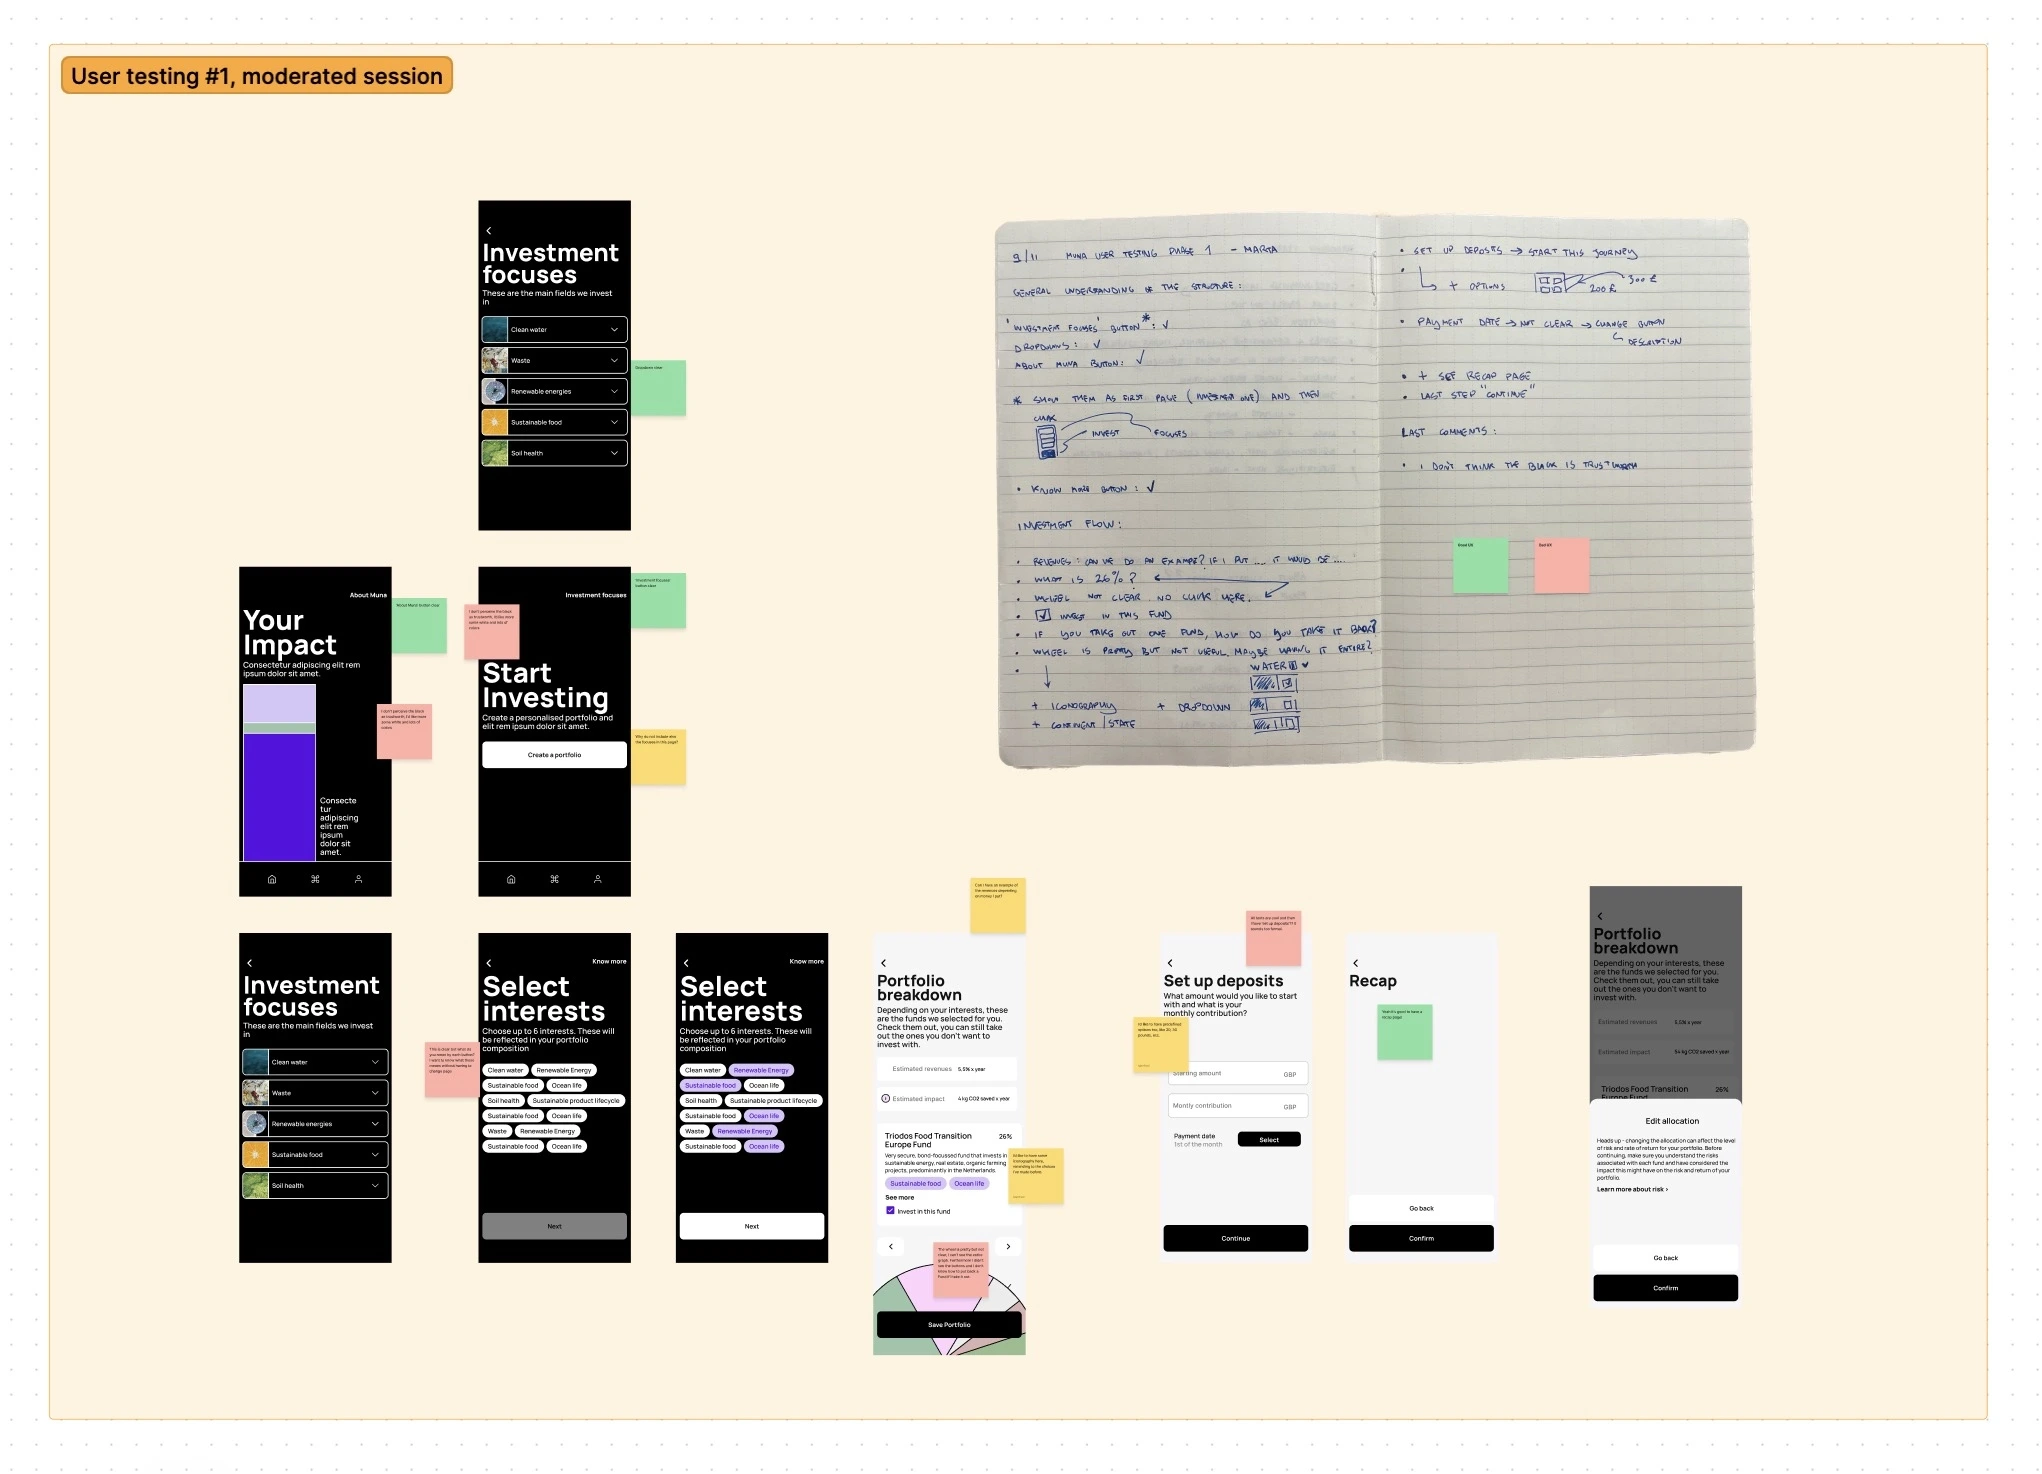
In moderated testing with the low fidelity prototype, we found a disconnect between the user choices and the portfolio composition. We would have to find a way to clarify that the allocation of funds was based on the user choices. We determined that we would provide additional affordance cues to simplify interaction with the portfolio UI. Furthermore, it seemed that our initial dark colour scheme was not perceived as trustworthy for a financial product.
Augmented Ice
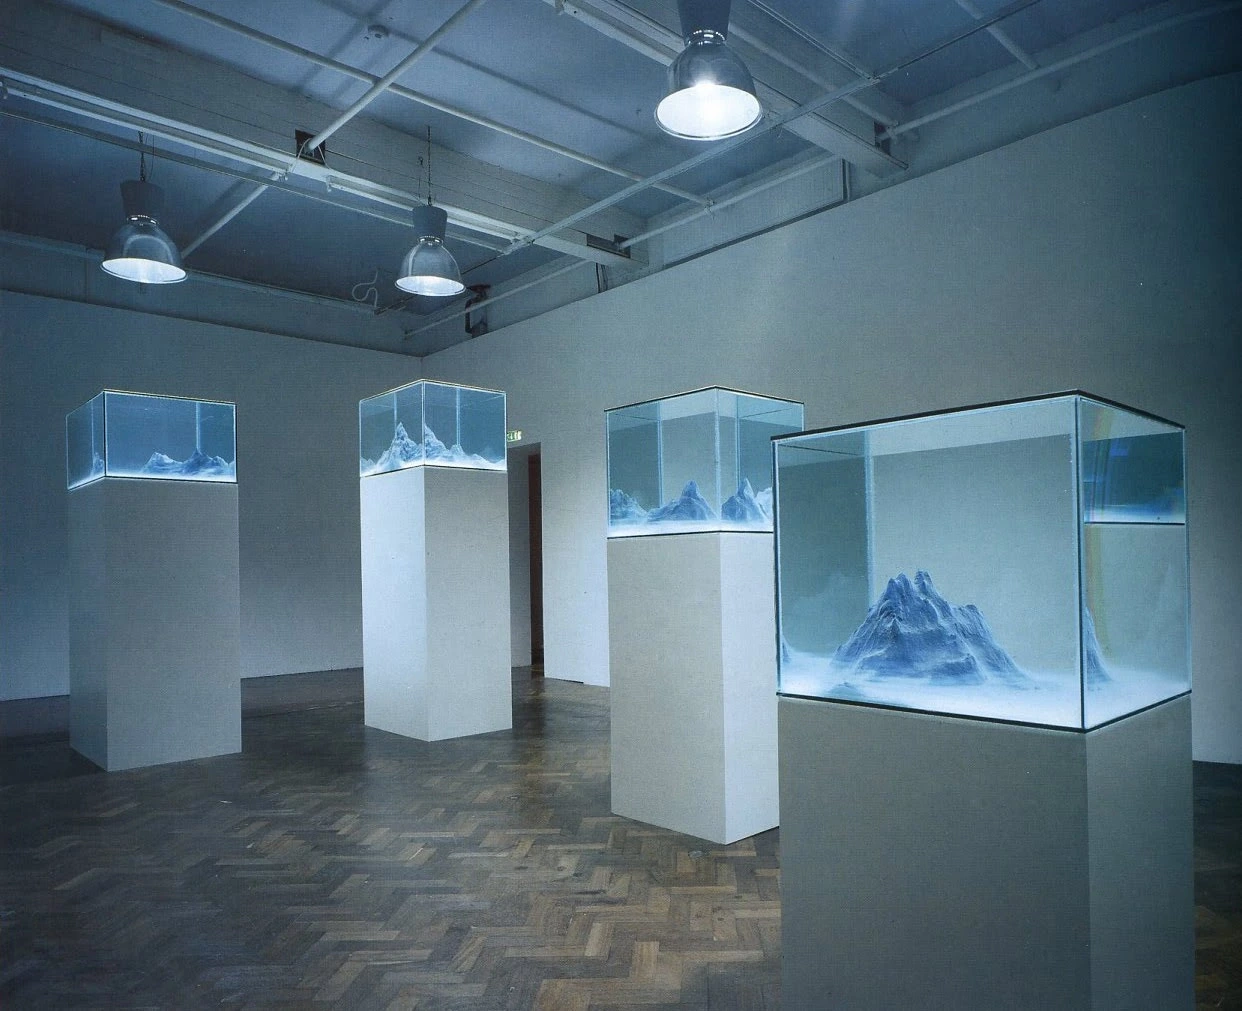
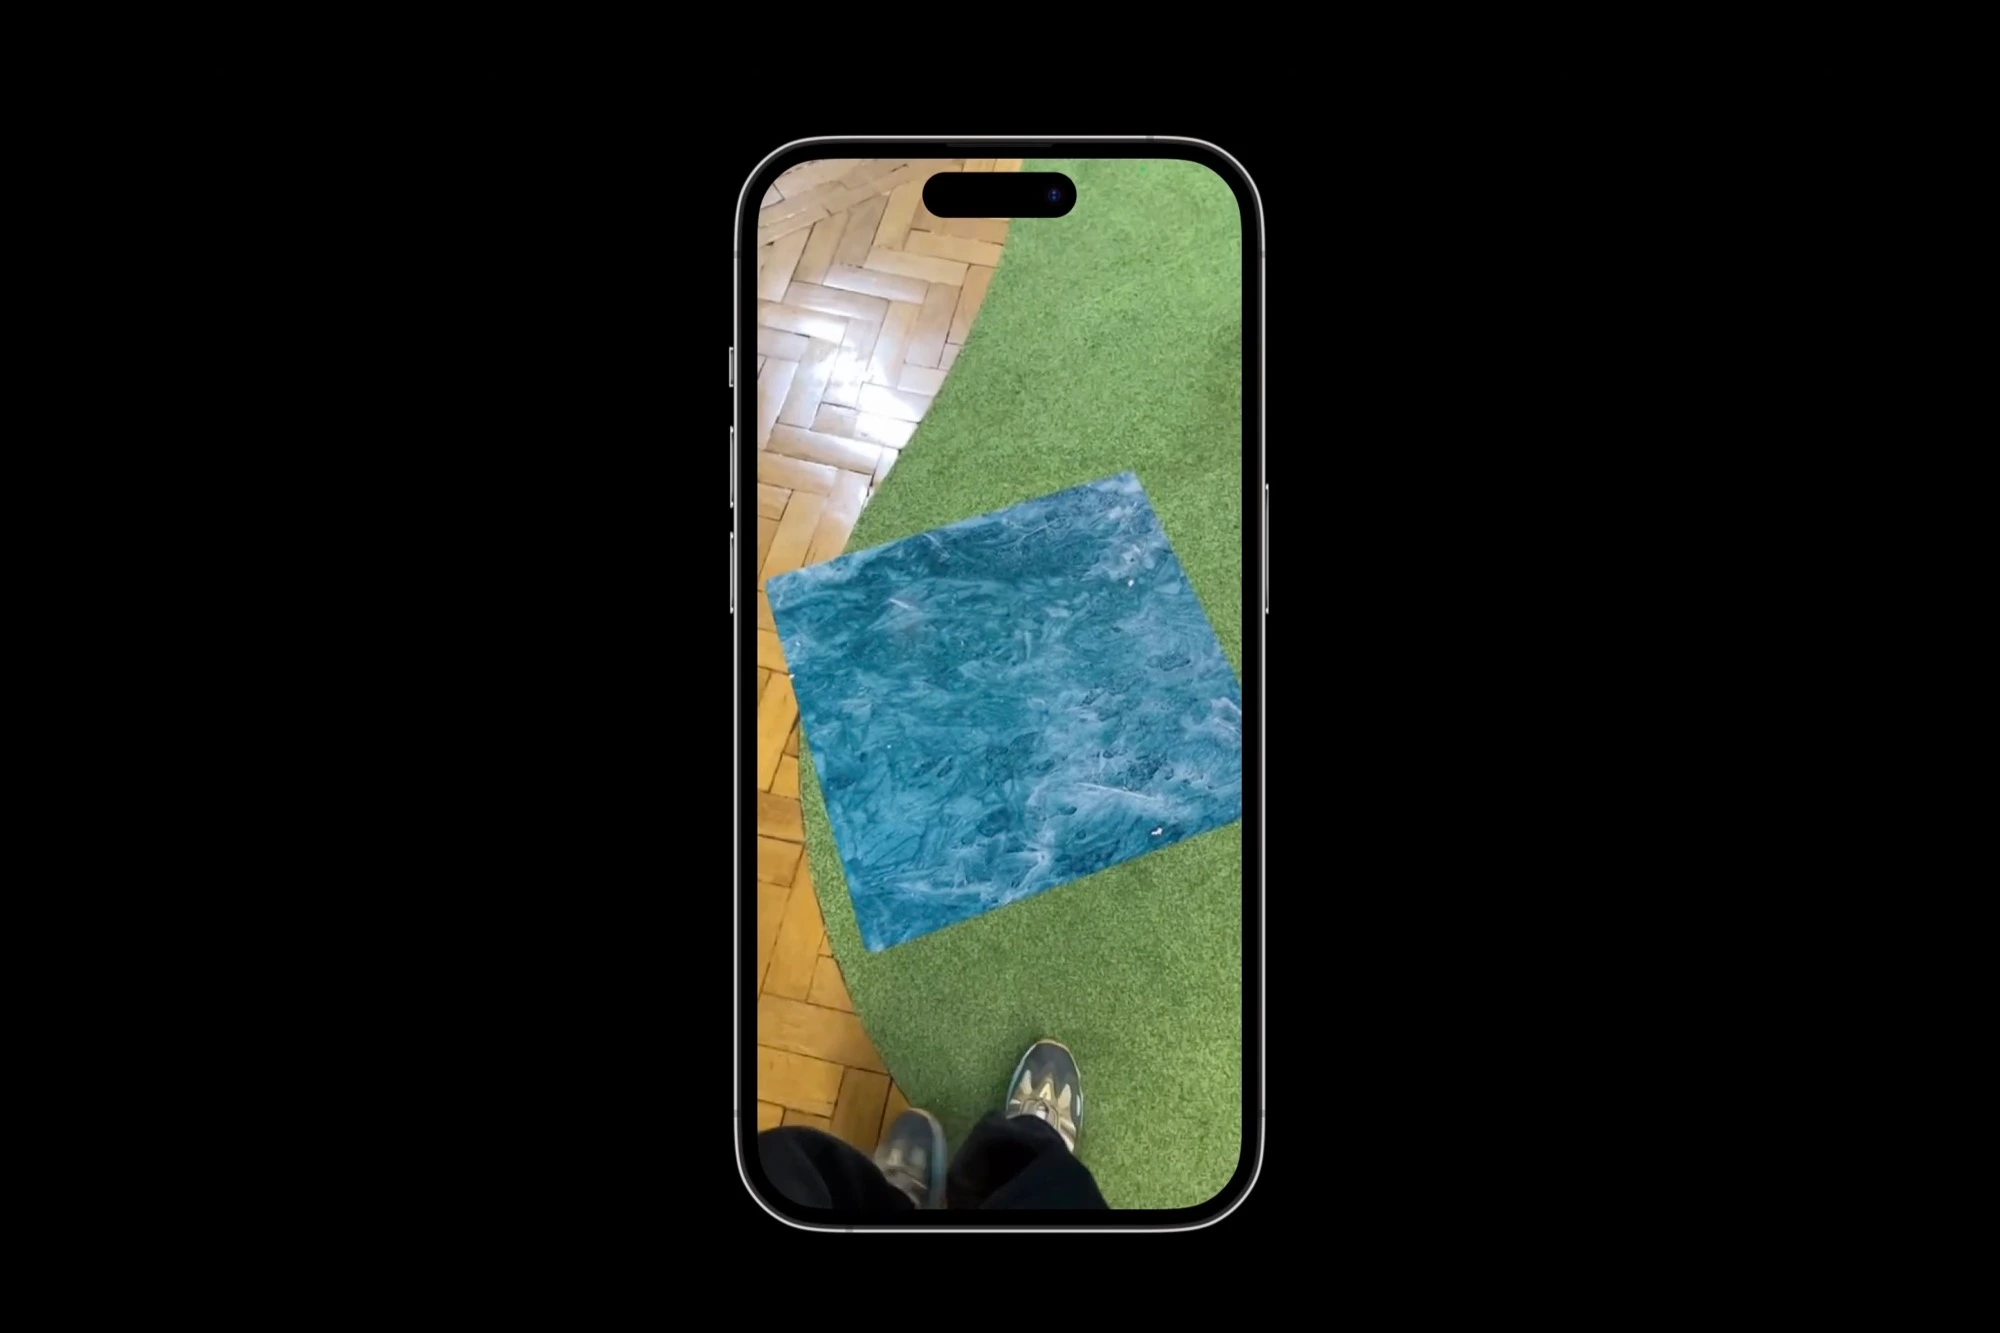
For the arctic ice visualisation we iterated through numerous versions of in-app and augmented reality presentation. Challenges included how to give a sense of scale in the internal visualisations and how to shift the focus from individual blame to an optimistic communal perspective. For the augmented reality visualisation Manfredi developed a variable-size 3d model that could be opened in Apple’s AR Quick Look as well as Android’s ARCore.
HIFI Prototype
Taking into account the findings from testing, our high fidelity prototype featured a dashboard-like home screen that served as an access point to impact visualisation, portfolio performance, settings and app referral. It furthermore included educational articles and deep-dives the most innovative companies included in the funds.
Final testing, with participants completing tasks in the app while thinking out loud, gave us markers for further improvements. Based on those we clarified some of the options in the settings page and adapted the portfolio section to allow a better overview. We were happy to find that most parts of the app, including the important impact visualisation, were received well.
Delivery
Delivery
Creating brand, website and exhibition materials
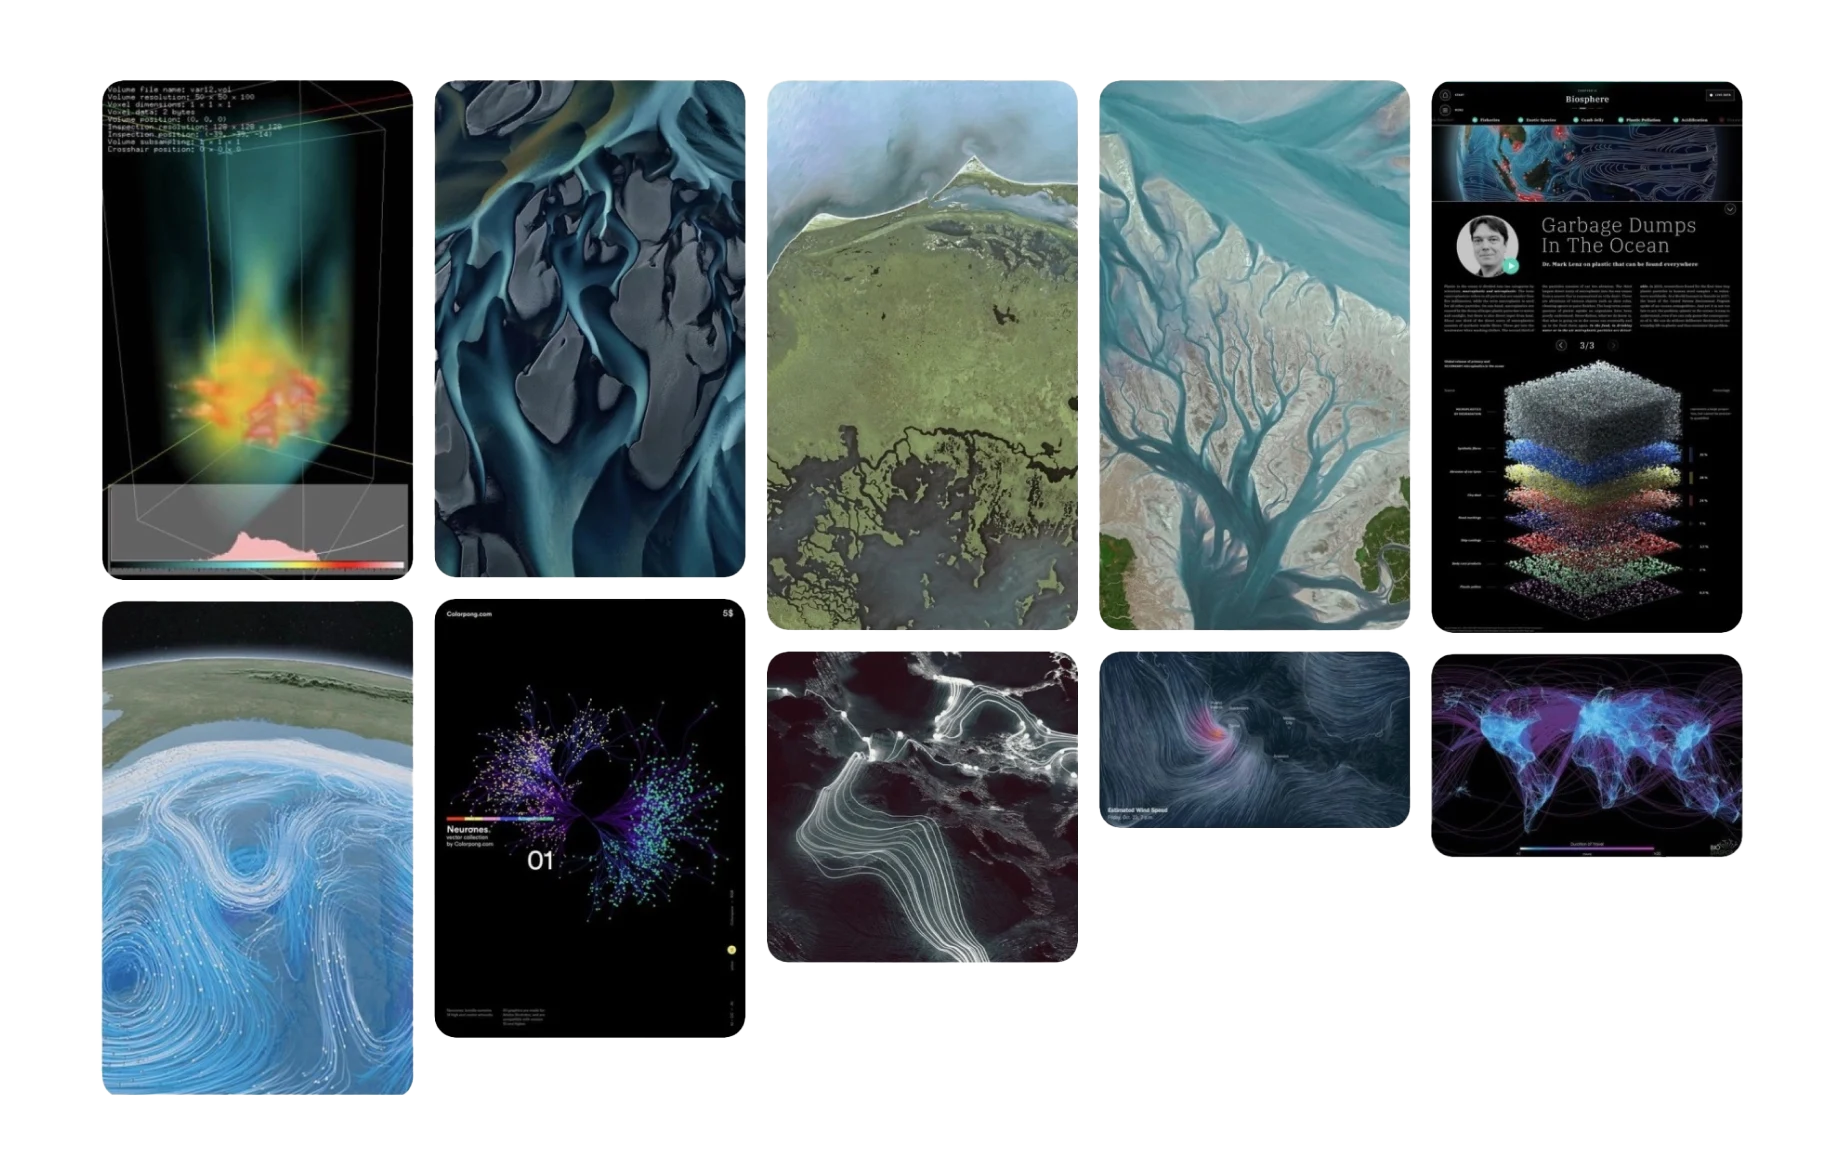
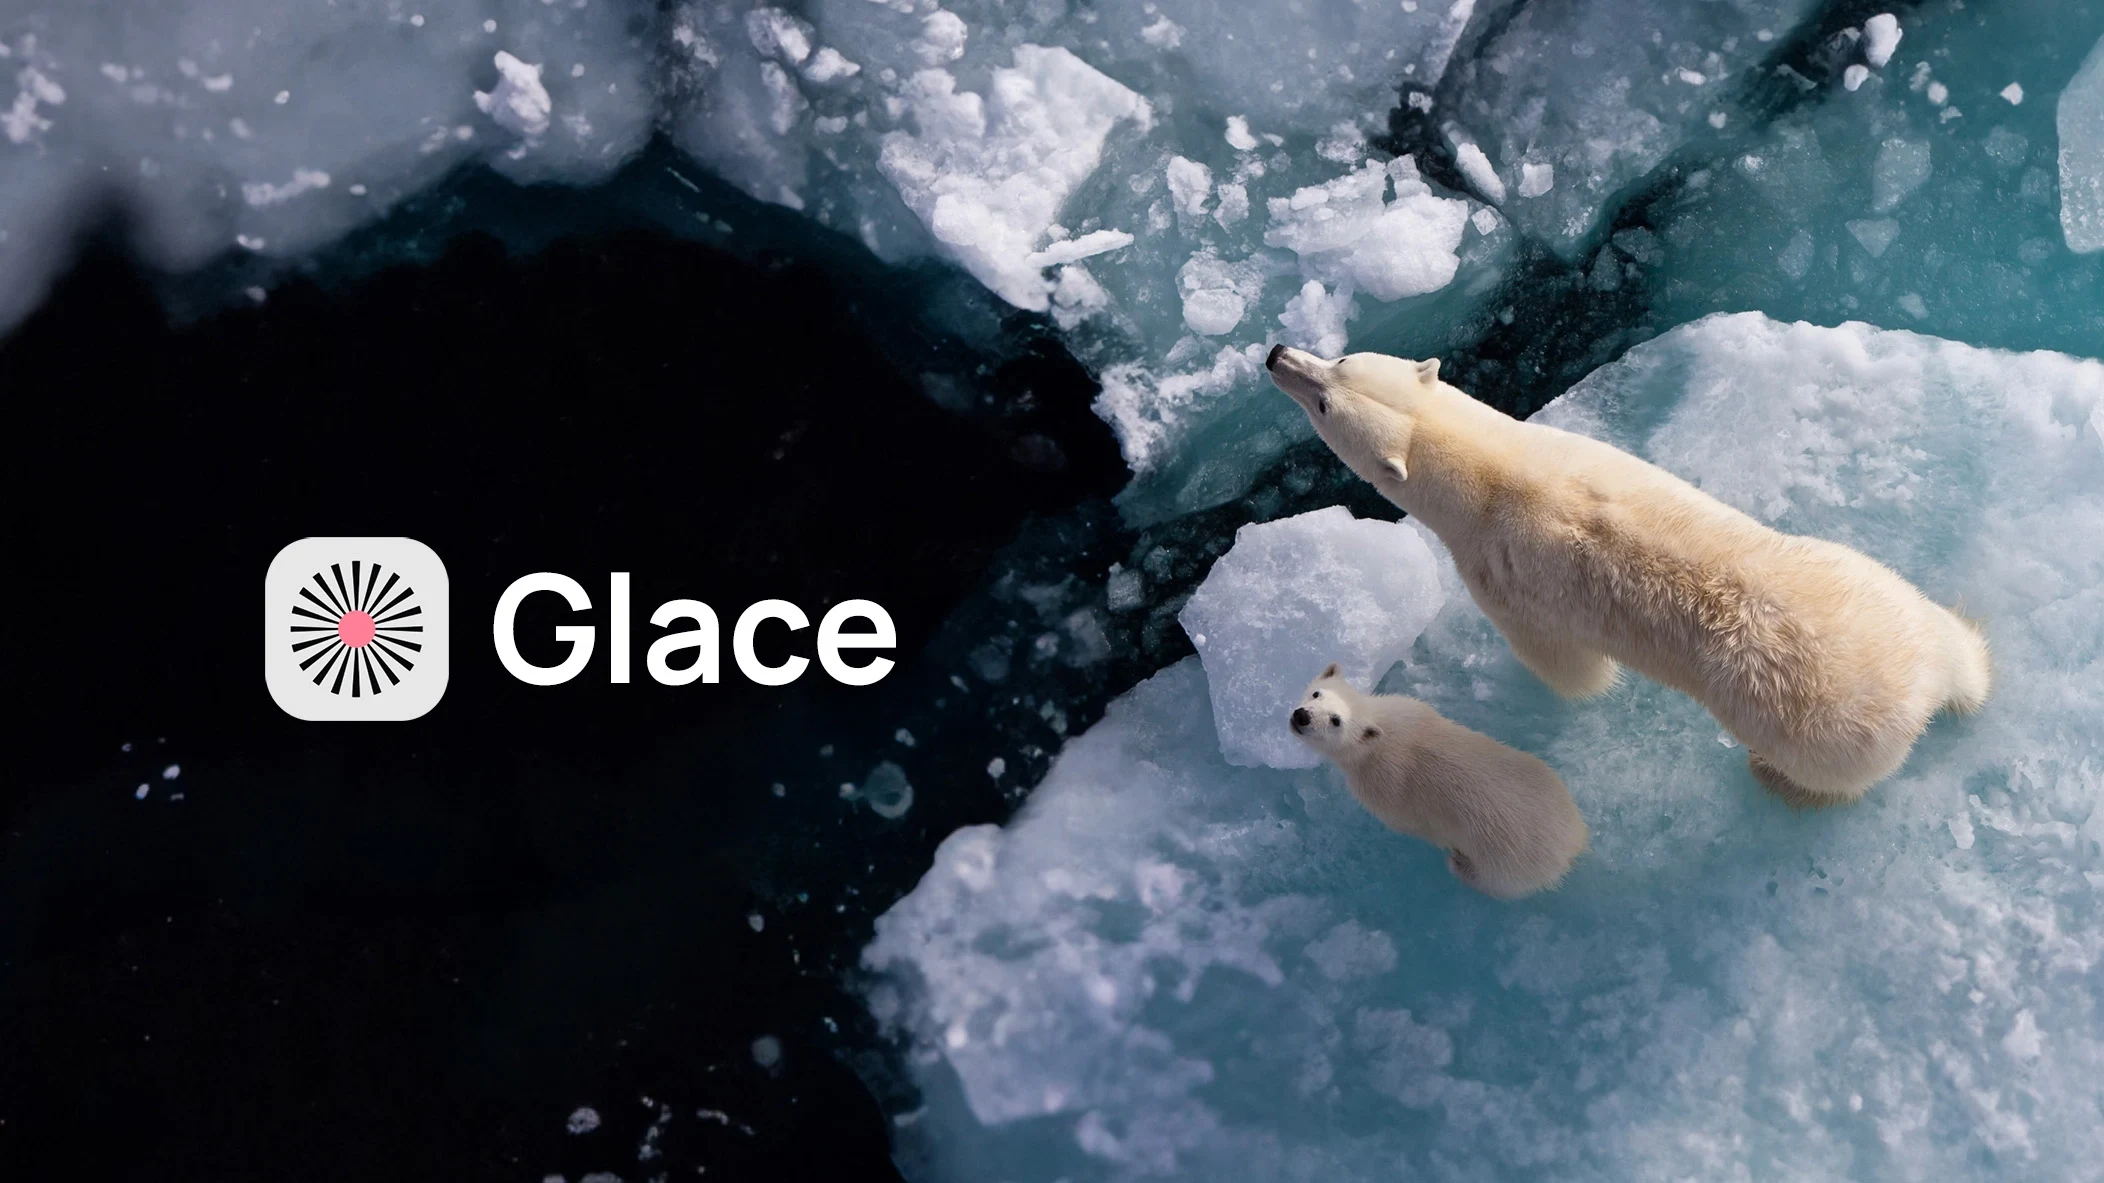
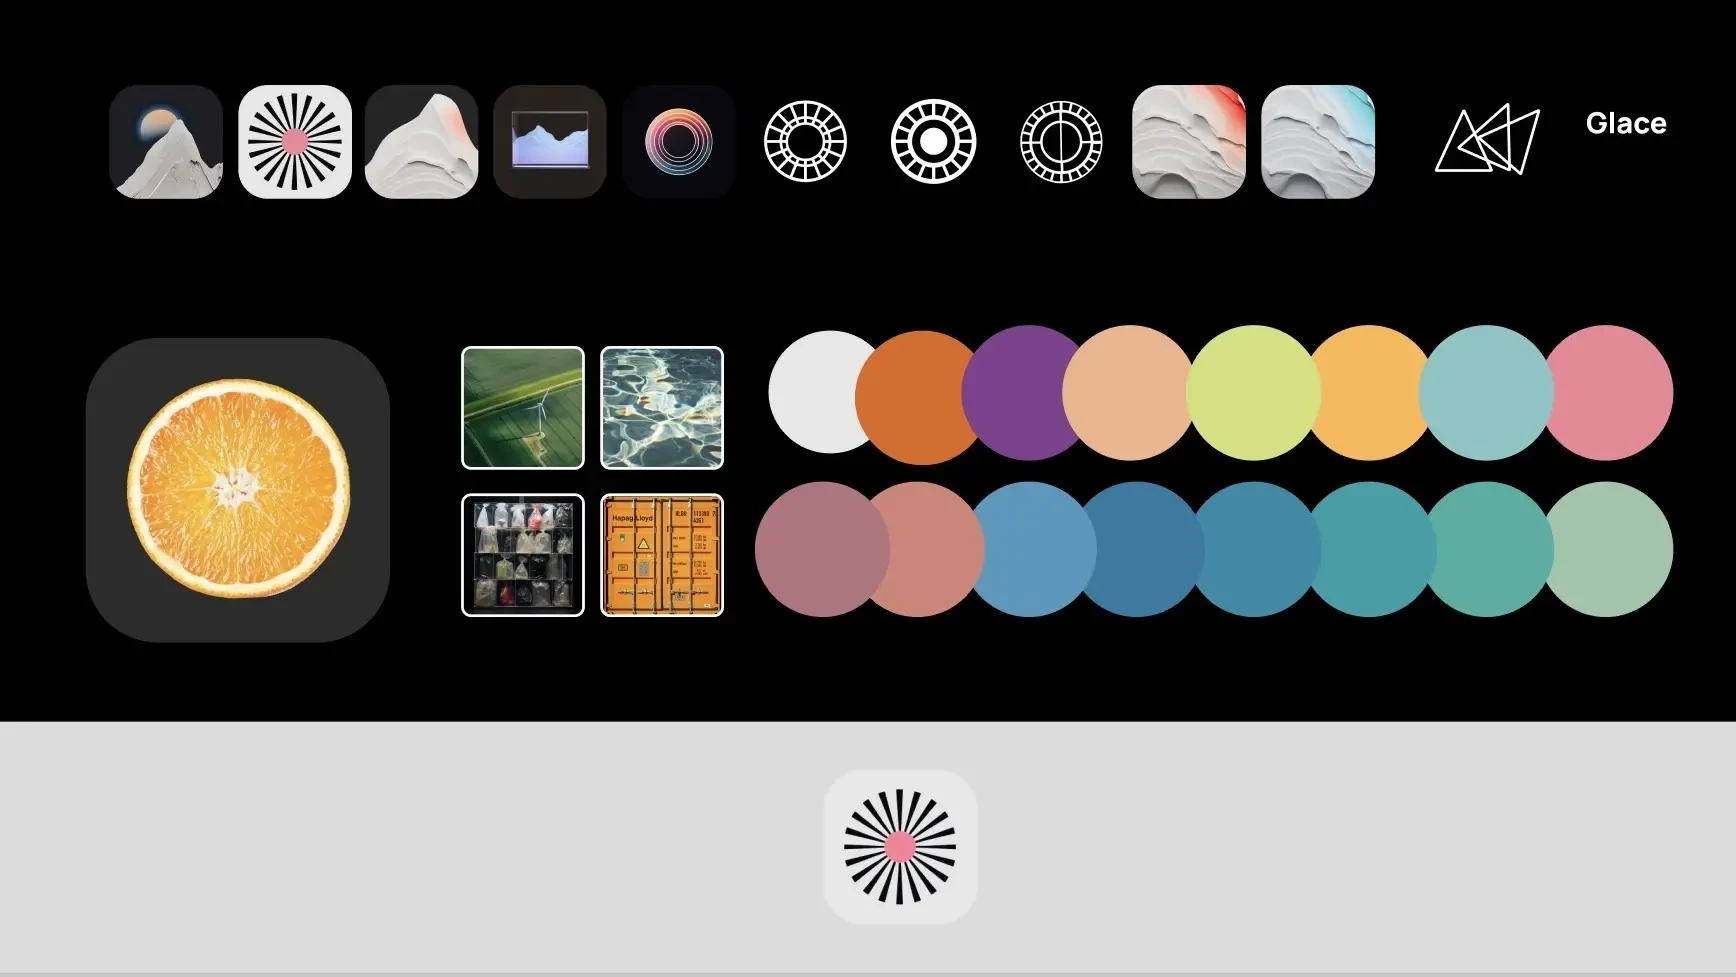
After multiple temporary names we settled on the name “Glace” for the platform. Leveraging our initial vibrant colour palette suited for young audiences, we expanded the visual identity with an app icon and style guide. A simplified representation of a rotating fan, literally used to cool an environment down, became our app icon. Using an AI image generator we created ominous, glowing blue ice visuals on dark backgrounds. A top-down image of ice bears helped us to add emotion to the rather technical portrayal of ice surface areas.
Website
To pitch the idea, I created a website with Next.js, TypeScript, HTML, Sass and Framer Motion (glace.earth). It features attention grabbing scroll-transitions and mockups of the final prototype. For most of the visual content we leveraged AI image generation and expansion tools.
Graduate Exhibition
For graduate showcase exhibition at University of the Arts London I created a video teaser explaining the concept. Apart from the video projection, our exhibition stall featured QR codes to open 3 sizes of our augmented ice sheet. Those were equivalent to yearly CO2 savings from: Using a reusable shopping bag all year, Investing $5000 dollars with “Glace”, Adopting on a plant-based diet.
We received great responses during the exhibition and had the chance to connect with entrepreneurs in the sustainability space, agency designers and potential users.